Download
1 / 38
380 likes | 400 Views
This overview discusses various tools and methods for measuring pulse trains and single amplified pulses. It includes information on correlations, Femtonitpicker, Picasso Spider, and Frog measurements, as well as the measurement of Carrier to Envelope Offset (CEO) and Carrier to Envelope Phase (CEP).

E N D
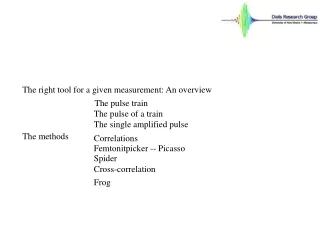
The right tool for a given measurement: An overview The pulse train The pulse of a train The single amplified pulse The methods Correlations Femtonitpicker -- Picasso Spider Cross-correlation Frog
The right tool for a given measurement An overview THE PULSE TRAIN TOOLS: Simple analog oscilloscope and frequency doubling crystal. Electronic Spectrum analyzer Spectrometer What to look for? Both fundamental and second harmonic: a straight line. No sideband and higher harmonics Continuous spectrum, central wavelength
The right tool for a given measurement An overview THE PULSE TRAIN Both fundamental and second harmonic: a straight line. Electronic Spectrum analyzer
The right tool for a given measurement An overview THE PULSE TRAIN What we should not see: Modulation of the train on a ms scale Q-switched-mode-locked train (Shows as a sideband on spectrum analyzer on a 100 KHz scale)
The right tool for a given measurement An overview THE PULSE OF A TRAIN Do you want to tune the laser to get the shortest pulse? TOOLS: Scanning autocorrelator, Intensity, interferometric, spatially encoded Spider Tuning a high power system Tuning a laser oscillator Single pulse characterization at high repetiton rate: SPIDER
The right tool for a given measurement Short pulse Stretched pulse Complex pulse shapc An overview THE SINGLE AMPLIFIED PULSE Single shot autocorrelations Cross-correlations (intensity and interferometric) Frog (high dynamic range) Femtonitpicker (Picasso) Spider Spider Basic difference between FROG and SPIDER: FROG: 2D frames Spider Frog SPIDER: 2 x 1D frames FASTER: pulse reconstruction at 1 kHz
The right tool for a given measurement Short pulse Complex pulse shapc An overview THE SINGLE AMPLIFIED PULSE Ultra- Single shot autocorrelations Cross-correlation Femtonitpicker (Picasso) Tadpole SEA- SPIDER Not so fast as spider: 2D frames Frog (high dynamic range) Spider
The choice of the optimum metrology method for a given problem Playing with analogies…. More serious stuff: what is a pulse what is a pulse train? The right tool for a given measurement: An overview The pulse train The pulse of a train The single amplified pulse The methods Correlations Femtonitpicker -- Picasso Spider Frog Measurement of Carrier to Envelope Offset (CEO) by “correlation” – next lecture Measurement of Carrier to Envelope Phase (CEP)
I t Correlations ref I s t Phase information: parallel polarization and replace the polarizing beam splitter by a non-polarizing beam splitter.
Intensity Interferometric Autocorrelation
Interferometric correlation
What do these autocorrelation tell us? Intensity autocorrelations: Continuous signal with100% mod. Cw + noise pulse
What do these autocorrelation tell us? Interferometric autocorrelations Linearly chirped pulse Bandwidth limited pulse
What do these autocorrelation tell us? How to measure a linear chirp.
Single shot interferometric autocorrelation
The choice of the optimum metrology method for a given problem Playing with analogies…. More serious stuff: what is a pulse what is a pulse train? The right tool for a given measurement: An overview The pulse train The pulse of a train The single amplified pulse The methods Correlations Femtonitpicker -- Picasso Spider Frog Measurement of Carrier to Envelope Offset (CEO) by “correlation” – next lecture Measurement of Carrier to Envelope Phase (CEP)
How to make a cross correlation when there is no shorter pulse available? b) Apply a transformation to the object, so that it can be observed The transformed object is visible “Linear Transformation” Object (a flea)
How to make a cross correlation The prism transforms the transverse coordinate into a delay when there is not shorter pulse available? Ideal for the range 100 fs to 1 ps. Reference pulse
How to make a cross correlation Reconstruction by iterative deconvolution when there is not shorter pulse available? Ideal for the range 100 fs to 1 ps. Example
Reduced phase accuracy How to make a cross correlation when there is no shorter pulse available? Advantages: Fast convergence (small number of iterations) Disadvantage: Small dynamic range, unless the pulse deformation is adjustable Uncertainty principle (should apply to all methods). The larger the temporal contrast between original and “transformed” pulse: References The better the amplitude reconstruction Femtonitpicker: Chi Yan and J.-C. Diels, J. of the Opt.~Soc.~Am.~B, 8:1259-1263 (1991) The smaller the interference contrast Picaso J.~W.~Nicholson and W.~Rudolph, J. of the Opt.~Soc.~Am.~B, 19:330-339 (2002)
Femtonitpicker and Picasso Reconstruction Pulse 1 short
Interferometric correlation Case of autocorrelation: the last term is the IFT of the second harmonic spectrum
Delay MOSAIC : a treatment derived from the interferometric autocorrelation MOSAIC Trace x 2 FFT FFT-1 0 0 Delay Frequency Frequency 1) M. Sheik-Bahae, Opt. Lett.22, (1997) 2) T. Hirayama and M. Sheik-Bahae, Opt. Lett. 27, (2002)
Unchirped Chirped 1.0 1.0 0.8 0.8 0.6 0.6 0.4 0.4 0.2 0.2 0.0 0.0 -0.2 -0.2 -200 -100 0 100 200 -200 -100 0 100 200 Delay (fs) Delay (fs) 1.0 1.0 0.8 0.8 0.6 0.6 0.4 0.4 0.2 0.2 0.0 0.0 -200 -100 0 100 200 -200 -100 0 100 200 Delay (fs) Delay (fs) Less information leads to … more info? By eliminating the middle term, we get more sensitivity to chirp Interferometric Auto Correlation MOdified Spectrum Auto Interferometric Correlation
15 1 pt. by pt. line search R-MOSAIC 10 5 0 Signal (a. u.) Phase (rad) 0.5 -5 -10 0 -15 -1 -1 -0.5 0 0 0.5 0.5 1 1 13 x 10 x 10 Frequency (Hz) *D. A. Bender and M. Sheik-Bahae, Opt. Lett. 32, 2822 (2007).
The choice of the optimum metrology method for a given problem Playing with analogies…. More serious stuff: what is a pulse what is a pulse train? The right tool for a given measurement: An overview The pulse train The pulse of a train The single amplified pulse The methods Correlations Femtonitpicker -- Picasso Spider Cross-correlation Frog
Measure: where Fourier transform The spectrum Extract SPIDER Spectral Phase Interferometry for Direct Electric-field Reconstruction Basic principle: Pulse to be measured shifted in frequency and delayed, and made to interfere with the original pulse in a spectrometer. Inverse Fourier transform: 2 one-dimentional measurements: The sheared spectrum
Chirp generator Sum frequency pulse Spectro- meter sequencer t SPIDER Spectral Phase Interferometry for Direct Electric-field Reconstruction Basic technique: The two pulses are “spectrally sheared” by the product with the chirped pulse
Chirp generator Sum frequency pulse Spectro- meter sequencer t SEA-SPIDER Spatially encoded arrangement for SPIDER Ideal for high (kHz) repetition rate SPIDER Advantage: 2 x 1D therefore fast (kHz) reconstruction 1. Raw data not informative Disadvantages: 2. Shear and delay not independent 2D data but ideal for ultrashort pulses
Ideal for few cycle pulses SEA-SPIDER Spectrum and shear along x, delay along y. Reference: Webb site of Ian Walmsley, thesis of Adam S. Wyatt (2007)
SEA-SPIDER The experimental setup
The FROG Frequency Resolved Optical Gating It is a time gated spectrum, measuring a two D function: Advantage: the raw data give a nice representation References: Disadvantage: considerable iterations FROG Trebino, Kluwer, 2002 Adam S. Wyat PhD Thesis University of Oxford (2007)
Spectrograms for Linearly Chirped Pulses Negatively chirped Unchirped Positively chirped Frequency Time Frequency Delay Like a musical score, the spectrogram visually displays the frequency vs. time (and the intensity, too).
The uncertainty principle applies – as in any other method Algorithms exist to retrieve E(t) from its spectrogram. The spectrogram essentially uniquely determines the waveform intensity, I(t), and phase, (t). There are a few ambiguities, but they’re “trivial.” The gate need not be—and should not be—much shorter than E(t). Suppose we use a delta-function gate pulse: = The Intensity. No phase information!
The choice of the optimum metrology method for a given problem Playing with analogies…. More serious stuff: what is a pulse what is a pulse train? The right tool for a given measurement: An overview The pulse train The pulse of a train The single amplified pulse The methods Correlations Femtonitpicker -- Picasso Spider Frog