Download

1 / 54
540 likes | 665 Views
This document outlines the strategic framework for selecting architectures within the SSES (Simulation and Evaluation System Solution) environment. It emphasizes the assessment of potential solution attributes and architecture feasibility, guiding the design of data structures and algorithms. Key considerations include integrating GUI-based development tools, model-driven data environments, and the expertise of the SSES team while acknowledging gaps in certain areas such as database design. The framework aims for efficiency in achieving stakeholder requirements and optimizing technical performance and operational effectiveness.

E N D
SSESSensor Suite Evaluation System SolutionSpace Evaluation and Architecture Selection Helen Anderson, Steven Beres, Joseph Shaw, Timothy Valadez Thursday, 26 March 2009 Anderson, Beres, Shaw, Valadez 1
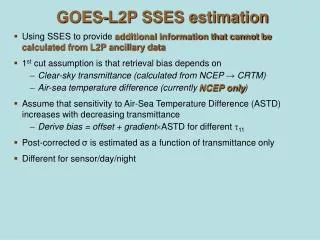
Core SSES Solution Space: Level of Integration / Automation Stove-piped Functionality Integrated Functionality GUI Based Development Tool Design environment Database / Expert System Manual Process / Procedure Model Driven Data Driven Data environment Anderson, Beres, Shaw, Valadez
SSES Architecture Selection Strategy: • 1. Assess potential solution attributes • Determine feasibility, utility of architectures • Not necessary / desirable to select implementation for individual functions at this point • 2. Select design and data environments • Primary drivers for overall SSES implementation • Shapes / prunes solution space for SSES functions and data structure design • 3. Select / design core SSES data structures and algorithms • 4. Select / design implementation for individual functions Highly desirable to maintain “core” architecture in prototype and objective SSES systems Expect function implementations to differ between prototype and objective SSES systems – favor simple implementations for proof-of-concept but provide path to evolve expand design Anderson, Beres, Shaw, Valadez
Overarching SSES Solution Considerations Anderson, Beres, Shaw, Valadez • SSES Team has: • Simulation design and analysis expertise • GUI development expertise • Computer programming expertise • Primarily Matlab with some VBA and Java • Network analysis expertise and tools • Access to DTED elevation data • Military and physical security expertise • SSES Team lacks: • Database design and programming expertise • Expert system design expertise • Significant software architecture expertise
Core architecture: Design Environment Anderson, Beres, Shaw, Valadez • GUI based design tool: Rationale: • Best able to support to meet stakeholder wants and functional requirements • Viable approach identified for all major functions • Best fit for model driven data environment • Most usable by ESS design team without additional training • Best potential to produce “eye catching” prototype / gain support for follow-on development • Best match for SSES team skill set
Core architecture: Data Environment Anderson, Beres, Shaw, Valadez • Primarily model driven, with supporting database components: Rationale: • Model / simulation provides most flexible and extensible design • Viable modeling approach identified for all major functions • Able to implement simple models for prototype and replace with higher fidelity models as follow on effort • Use “simple” data components for threat, environment, terrain types, sensor performance for some sensors • Allows use of existing modeling and analysis tools: • Network analysis • Queuing theory • Sensor / detection models / theory • Sensor fusion • Provides ability to generate first-order results from first principles • Major obstacle for data driven design is getting / generating the required data and populating databases • Best match for SSES team skill set
Solution Scoring & Symbology GUI based design environment is generally associated with model driven approach Database design environment is generally associated with data driven approach Anderson, Beres, Shaw, Valadez • Attribute scoring • No options are automatically disqualified – but … • Solutions scored as – have significant challenges / deficiencies and will only be selected if all other solutions are even worse • Solution Applicability: • G = Primarily applicable to GUI based design environment • M = Primarily applicable to model driven environment • D = Primarily applicable to database / data driven environment • P = Primarily applicable to manual / procedural design environment
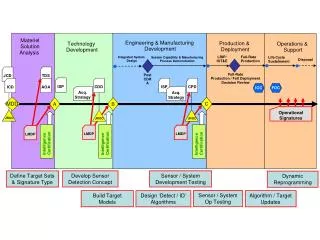
Design & Assess ESS SSES Functional Decomposition 1 Assess and represent site characteristics 3 Develop ESS designs and assess technical performance 4 Assess ESS operational performance 2 Assess and represent threat characteristics 3.2 Model emplaced single sensors 3.3 Model multi-sensor networks 2.1 Classify threats by type & attributes 4.1 Analyze operational performance 1.1 Get and use site attribute data 1.2 Construct site model 3.1 Represent single sensor performance 3.5 Optimize ESS designs 4.1.1 Route specific MOE 2.2 Manage signature data 3.3.1 Construct sensor networks 4.1.1.1 Min ingress / egress time 3.3.1.1 Manual selection 3.1.1 Maintain sensor database 2.2.1 Threat type & number 1.2.1 Construct terrain type map 1.2.1.1 Partition by terrain type 1.1.1 Get/display/ use terrain and feature data 3.3.1.2 Heuristic selection 3.1.2 Represent sensor Pd 2.2.2 EO/IR signature 4.1.1.2 Minimum Pd 1.1.1 Terrain types 3.1.3 Represent sensor range 2.2.3 Radar signature 3.3.1.3 Form networks 4.1.1.3 Minimum reaction time • 1.1.1.2 • Topographic data 1.2.2 Construct elevation model 2.2.4 RF signature 3.1.4 Represent false alarm rate 3.2.2 Place / orient sensors 3.3.2 Assess coverage, performance, cost 1.1.1.3 Feature data 2.2.5 Acoustic signature 1.2.3 Construct mobility model 3.1.5 Environ-mental effects 3.2.2.1 Manual selection 3.3.2.1 Sensor architectures 4.1.2.1 Perimeter Pd & Pinterdict 1.1.1.4 Elevation data 3.1.6 Represent sensor FOV 2.3 Support sensor models 1.2.3.1 Move rates and dwell times 3.2.2.2 Semi-auto selection 3.3.2.2 Apply sensor fusion 4.1.2.2 Worst case area Pd 3.1.7 Represent scan/revisit times 1.1.1.5 Imagery 3.2.3 Model sensor coverage and Pd 3.3.2.3 Determine point Pd 4.1.2.3 Worst case Pkeep-out 1.2.3.2 ID Ingress/egress routes 3.1.8 Support requirements 3.2.3.1 Model detection 3.3.2.4 Determine area Pd 3.1.9 Estimate single sensor cost 4.1.3 Display vulnerability 3.4 Estimate Sensor Network Cost 1.1.2 Get/display/use environment data 3.2.3.1.1 Calculate LOS 3.3.2.5 Determine network FAR 1.2.4 Manage site models & data 1.1.2.1 Weather 4.1.3.1 Max vulnerability routes 3.2.1 Select sensors 4.1.2 Assess vulnerability 3.2.3.1.2 Propagation loss 3.4.1 Installed + infrastructure costs 3.5.1 Manage designs and MOE/MOP 3.3.3 Show coverage, & performance 1.1.2.2 EM/RF interference 2.5 Represent threat objectives 2.4 Manage threat mobility data 4.1.3.2 Min response time routes 3.2.3.1.3 Field of view 3.2.1.1 Manual selection Level 3.3.3.1Point-to-point Pd 1.1.2.3 Traffic 3.5.2 Manually iterate designs 2.4.1 Speed over terrain 2.5.1 Intrusion objectives 3.2.3.1.4 Terrain type 3.2.1.2 Semi-auto selection 4.1.3.3 Cumulative Pd coverage 0 3.3.3.2 Area Pd 3.5.3 Heuristically iterate designs 1.1.2.4 Manage environ. data 1 3.2.3.1.5 Environment 2.5.2 Covertness posture 2.4.2 Prohib-ited terrain 3.2.1.3 Auto-matic selection 4.2 Estimate ESS total cost 2 3.3.3.3 Coverage by sensor type 3.2.3.1.6 Pd at discrete points 2.5.3 Survivability objectives 2.4.3 Barriers & obstacles 3 4.2.1 Procure, install, operate cost 3.3.3.4 Gaps and blind spots 3.2.3.1.7 Area aggregate Pd 4 Anderson, Beres, Shaw, Valadez 5 3.3.3.5 False alarm rate 2.6 Support route planning models 3.2.3.1.8 False alarm rate
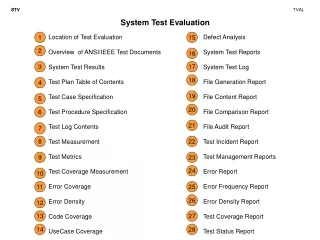
SSES Data Architecture ESS Design & Performance Archive Sensor Suite Probability of Detection Network Sensor Suite False Alarm Rate Environment Database Intruder Paths & Dwell Times Area sensors Connectivity Sensor Fusion Line sensors Threat Specific Movement Network Threat Database Sensor Database Terrain & Feature Database Terrain Type Partition Network Generic Trafficability Network Sensor Network Sensor Lay-down List Terrain Obstacle & Feature Data Single Sensor Probability of Detection Network Single Sensor False Alarm Rate Core SSES Data Structures Registered Imagery Registered Elevation Data Grid External Data / Databases Raw Image / Map Data DTED Elevation Data Other DEM Data Anderson, Beres, Shaw, Valadez
Next Steps Anderson, Beres, Shaw, Valadez • Refine data structure details • Define software module structure • Required functionality • Data structure interfaces • Algorithm selection • Define external database content and format • Define GUI functionality and designer controls and displays
Functional Decomposition and Solution Evaluation Drill-down Anderson, Beres, Shaw, Valadez
SSES Function - Form Alternatives 1.1.1 FUNCTIONS FORMS ATTRIBUTES 1. Represent and assess site characteristics 1.1 Obtain, display, and use site attributes and characteristics data 1.1.1 Obtain, display, and manipulate topographic, characteristic, and feature data • ++ Provides greatest flexibility in specifying terrain characteristics • - Increased storage requirements • - - Very high analyst workload if terrain characteristics are entered manually for all terrain patches 1.1.1.1 Classify terrain based on physical characteristics that may affect sensor performance, and threat mobility and detectability • Direct specification of individual terrain characteristics (M,D,P) • Indexed terrain data with exemplars (M,D) • Hybrid - indexed with editable characteristics (M,D) • - Limits flexibility in specifying terrain characteristics – can only represent terrain types that are in database • + Reduced storage requirements • ++ Low analyst workload to enter terrain data • ++ Provides same flexibility in specifying terrain characteristics as direct specification • - Increased storage requirements • o Analyst workload increase depends on number of terrain regions where characteristics are edited manually Anderson, Beres, Shaw, Valadez
SSES Function - Form Alternatives 1.1.1 FUNCTIONS FORMS ATTRIBUTES 1. Represent and assess site characteristics 1.1 Obtain, display, and use site attributes and characteristics data 1.1.1 Obtain, display, and manipulate topographic, characteristic, and feature data • Obtain • Manual data entry / editing (G,D,P) • Software enabled manual capture of image / map data (G) • Automated pattern/feature recognition of image data (G,D) • Direct interface with GIS databases and image archives (G,D) • Display / manipulate: • Paper maps with overlays (P) • Hard copy tabular data (P) • Interactive GUI development environment (G) 1.1.1.2 Obtain, display, and manipulate topographic, characteristic, and feature data • + Lowest development and coding effort • - Highest analyst workload – provides no cognitive or visualization support • - Significant development and coding effort required – but supportable within project timeframe • + Reduced analyst workload • ++ Enables analyst visualization and comprehension • ++ Significant reduction in analyst workload • - - Significant development and coding effort required – not supportable within project timeframe ++ Greatest reduction in analyst workload + Increased terrain specification accuracy - - Significant development and coding effort required – not supportable within project timeframe • - Only supports manual approach, does not support any type of automation • - - Significant effort required to generate map overlays • -- Only supports manual approach, does not support any type of automation • ++ Provides greatest support for analyst visualization, comprehension, and manipulation of data • - Significant level of effort to design and code, but supportable within project timeframe Anderson, Beres, Shaw, Valadez
SSES Function - Form Alternatives 1.1.1 FUNCTIONS FORMS ATTRIBUTES 1. Represent and assess site characteristics 1.1 Obtain, display, and use site attributes and characteristics data 1.1.1 Obtain, display, and manipulate topographic, characteristic, and feature data 1.1.1.3 Obtain and represent data on discrete site features and objects that may affect sensor performance or threat mobility • ++ Provides greatest flexibility in specifying feature geometry • - Storage requirements proportional to number of feature surfaces • - Computational effort for line-of-site calculations proportional to number of feature surfaces • - Greater coding effort to implement • Patch and facet / wire frame models (M) • Coordinate geometry models (M) • Data base position/shape entry (D) Patch and coordinate geometry approaches are complementary not mutually exclusive – Intend to implement coordinate geometry approach first, with patch model as stretch objective - Only allows specification of features that can be approximated by simple coordinate geometry equations, e.g. cube, sphere, cone, etc. + Low storage and computational effort for line-of-site calculations than for coordinate geometry models + Relatively simple to implement • - Unclear how database position / shape data would be stored and employed – expect database entry would specify either patch & facet or coordinate geometry data similar to model representation Anderson, Beres, Shaw, Valadez
SSES Function - Form Alternatives 1.1.1 FUNCTIONS FORMS ATTRIBUTES 1. Represent and assess site characteristics 1.1 Obtain, display, and use site attributes and characteristics data 1.1.1 Obtain, display, and manipulate topographic, characteristic, and feature data ++ Team has access to DTED level I data on CD ++ Minimal effort to implement (stand alone) since DTED data import functionality is available in Matlab Mapping Toolbox – additional effort would be required to integrate into GUI - Sufficient to for proof of concept demo • Software import of DTED data from file / CD (M,D) • Software import of other DEM data from file / CD (M,D) • Direct interface with GIS systems (M,D) • Automated interpolation of map/image contours (M,D) • Manual parsing and entry of elevation data (P) 1.1.1.4 Obtain, display, and manipulate site elevation data from external sources • - Currently don’t have access to digital elevation map data other than DTED • - Potentially significant effort to implement • - Single elevation source (i.e. DTED) is sufficient to for proof of concept demo ++ Significant reduction in analyst workload - - Significant development and coding effort required – not supportable within project timeframe ++ Allows generation of elevation data with higher resolution and accuracy than DTED data (DTED Level 1 grid spacing ~90m – may not be sufficient for some applications) + Moderate effort to implement (stand alone) since manual image tracing and interpolation functionality is available in Matlab – additional effort would be required to integrate into GUI • - - Only supports manual approach, does not support any type of automation • - - Significant effort required to parse hard copy imagery 1.1.1.5 Obtain, display, and utilize site imagery data • File of hardcopy imagery (P) • Image database with display tools (M) • ++ Supports analyst visualization and manipulation of image data • - Moderate effort required to implement – leverages Matlab inherent figure display and manipulation tools Anderson, Beres, Shaw, Valadez
SSES Function - Form Alternatives 1.1.2 FUNCTIONS FORMS ATTRIBUTES 1. Represent and assess site characteristics 1.1 Obtain, display, and use site attributes and characteristics data 1.1.2 Represent environmental characteristics and assess environmental effects on ESS sensor and network performance 1.1.2.1 Represent weather including temperature, precipitation, airborne particulates, and winds • ++ Provides greatest flexibility in specifying environmental characteristics • - Increased analyst workload to explicitly specify all environmental parameters • - Slightly greater effort required to implement • Direct specification of weather parameters (M) • Indexed weather data with standard environments (M,D,P) • Hybrid - indexed environments with editable parameters (M,D) • - Limits flexibility – can only represent environments included in database • ++ Low analyst workload to enter terrain data • ++ Provides same flexibility in specifying environment characteristics as direct specification • + Little increase in analyst workload –update only selected parameters and only if desired • ++ Provides greatest flexibility in specifying RF characteristics • - Increased analyst workload to explicitly specify all environmental parameters • - Slightly greater effort required to implement • Direct specification of EM / RF environment by type (M) • Indexed EM / RF with standard densities (M,D,P) • Hybrid – indexed RF environments with editable parameters 1.1.2.2 Represent electromagnetic and radio-frequency interference that may interfere with sensors and wireless networks • - Limits flexibility – can only represent RF environments included in database • ++ Low analyst workload to enter terrain data • ++ Provides same flexibility in specifying RF environment characteristics as direct specification • + Little increase in analyst workload –update only selected parameters and only if desired Anderson, Beres, Shaw, Valadez
SSES Function - Form Alternatives 1.1.2 FUNCTIONS FORMS ATTRIBUTES 1. Represent and assess site characteristics 1.1 Obtain, display, and use site attributes and characteristics data 1.1.2 Represent environmental characteristics and assess environmental effects on ESS sensor and network performance • ++ Provides greatest flexibility in specifying traffic characteristics • - Increased analyst workload to explicitly specify traffic parameters • - Slightly greater effort required to implement • Direct specification of traffic density by type • Indexed traffic density with standard densities • Hybrid – traffic density with editable parameters 1.1.2.3 Represent personnel, vehicular, and animal traffic that may trigger sensors • - Limits flexibility – can only represent environments included in database • ++ Low analyst workload to enter terrain data • ++ Provides same flexibility in specifying traffic characteristics as direct specification • + Little increase in analyst workload –update only selected traffic parameters and only if desired • On further review, we determined that “software model environment database” is a misnomer – actual need is to maintain a database of environmental factors / parameters for use by SSES models – e.g. sensor performance models – and trade space is to maintain internal or external to SSES • Software model environment database (M) • Electronic environment database (D) • Hard copy tabular environment data (P) 1.1.2.4 Maintain a list/database of environmental conditions / factors • - - Only supports manual approach, does not support any type of automation • - - Significant effort required to parse hard copy imagery Anderson, Beres, Shaw, Valadez
SSES Function - Form Alternatives 1.2.1 FUNCTIONS FORMS ATTRIBUTES 1. Represent and assess site characteristics 1.2 Construct, display, and manipulate site models / analytic representations • - Supports model based approach only • ++ Most intuitive / easiest to use approach, interfaces can be similar to common PC based applications, does not require database expertise • + Allows graphical interface and display • ++ SSES team has GUI development and model design expertise • + Provides flexibility in implementing sensor models and logic • + Candidate Matlab development environment has existing toolboxes for many OR, mapping, and image processing functions 1.2.1 Construct, display, and manipulate site terrain characteristics models • Software models with GUI (M+G) • Database model with query tools (D) • Hard copy tabular data (P) • Hard copy map with terrain shading (P) • - Supports database approach only • - Likely to require database query expertise or additional operator training • - - SSES team lacks database design, implementation, and management expertise • - SSES team lacks clear vision of how to implement sensor performance, terrain, and threat behavior models using database approach • + Use of standard database software package (e.g. MS Access) could facilitate interface with GIS and other data, as well as export of design data to documents and presentations • -- Only supports manual approach, does not support any type of automation Anderson, Beres, Shaw, Valadez
SSES Function - Form Alternatives 1.2.1 FUNCTIONS FORMS ATTRIBUTES 1. Represent and assess site characteristics 1.2 Construct, display, and manipulate site models / analytic representations • ++ Can support model, database, or manual approaches • ++ No effort required for development of partitioning or data import / export tools • - - Potentially very high workload needed to construct terrain models/data and enter into SSES application – may significantly limit size / detail of site representations • - High potential for data entry errors • Manual partitioning of terrain map/image data with manual data entry (M+G,D,P) • Software enabled manual partitioning of terrain map/image data with direct data entry (M+G,D,P) • Automated partitioning of terrain map/image data (M) • Automated partitioning of terrain database data (D) 1.2.1.1 Partition site into regions with homogeneous terrain characteristics ++ Can support model, database, or manual approaches, implementation details would be tailored to terrain representation decision / design - Significant effort required for development of partitioning or data import / export tools – but appears feasible within course timeline + Partitioning tools may be able to be leveraged to provide other SSES functionality -- particularly if network representation is selected ++ Significantly reduces workload associated with terrain model / database construction + Complementary with graphical interface and display • + Can support model or database approaches • ++ Potentially very significant reduction in workload associated with terrain model / database construction • - - SSES team lacks clear understanding of how automatic terrain partitioning and map generation could be accomplished • - - Does not appear to be executable within course timeline • - - Not necessary for SSES concept demonstraion Anderson, Beres, Shaw, Valadez
SSES Function - Form Alternatives 1.2.2 FUNCTIONS FORMS ATTRIBUTES 1. Represent and assess site characteristics 1.2 Construct, display, and manipulate site models / analytic representations • + Supports model based prototype (directly) and database approach indirectly • + Allows use of DTED grid data directly • + Simplest to implement – good fit for Matlab graphing functionality • + Keeps elevation data independent of terrain patches – no need to update elevation for changes in terrain partitioning • ++ Allows use of existing Matlab mapping toolbox Line-of-site functionality • Terrain partitions will generally not be co-planar so line-of-sight may not be consistent for all points within a terrain partition • + Computationally efficient since LOS may be calculated on demand • Terrain elevation data grid model with editor (M+G) • Terrain elevation data patch model with editor (M+G) • Terrain elevation database with query tools (D) • Hardcopy terrain elevation map (P) • Physical relief map / model (P) 1.2.2 Construct, display, and manipulate site terrain elevation models • ++ Supports both model based and database approaches • - - More complex implementation if used for LOS determination • Still need terrain grid data since source elevation data is in grid format • Requires development of functionality for patch based line-of-site determination • + Aligns elevation data with terrain partitions since by definition partitions are co-planar and have common line-of-sight • Elevation data must be updated whenever terrain partitions change • + Computationally efficient since LOS may be calculated on demand • - Only supports database approach • - - Most complex implementation since we still need grid or patch model to generate database entries initially and because elevation source data is in grid format, database construction is an extra step • + Computationally inefficient since LOS must be pre-calculated for all sensor-target pairs • -- Only supports manual approach, does not support any type of automation Anderson, Beres, Shaw, Valadez
SSES Function - Form Selection 1.2.3 FUNCTIONS FORMS ATTRIBUTES Three separate but related issues: Form of mobility /trafficability model / database Selection of dense (all points to all other points) or sparse (points to immediate neighbors only) Method for constructing the model / database from underlying terrain and threat data Defer dense / sparse and construction decision pending selection of representation 1. Represent and assess site characteristics 1.2 Construct, display, and manipulate site models / analytic representations • ++ Supports model / GUI approach directly and is a likely intermediate step for database approach • ++ Analytically tractable, leverages mature network analysis methodologies • ++ Allows use of existing Matlab BGL network toolbox for analysis • ++ Natural fit with terrain partition model approach and use of area / boundary sensor types • ++ Allows use of threat and terrain independent network topology with threat and terrain specific edge weights • + Computationally efficient since movement and paths may be calculated on demand • + Directly supports graphical display of threat routes 1.2.3 Construct, display, and manipulate threat dependent trafficability models • Representation • Sparsely connected network model with edge rates/costs (M) • Point-to-point movement database (D) • Hard copy map with mensuration tools (P) • - Only supports database approach • - - More complex implementation since use of database does not address how we generate the model to generate database entries initially – will still require network model or • - - Computationally and storage inefficient since movement rates / costs must be pre-calculated for all routes and updated if terrain or threat changes • -- Only supports manual approach, does not support any type of automation Anderson, Beres, Shaw, Valadez
SSES Function - Form Alternatives 1.2.3 FUNCTIONS FORMS ATTRIBUTES 1. Represent and assess site characteristics 1.2 Construct, display, and manipulate site models / analytic representations • + Supports both model (directly) and database (indirectly) approaches • ++ Straightforward to implement if threat movement rate as a function of terrain is available from model or database • ++ Natural fit with partitioned terrain model and network representation • + No need to pre-compute distances and rates following terrain map updates • - Potentially longer run times since shortest paths and path lengths are computed for each run • + Readily supports with graphical display of distances and paths • ++ Good enough to demonstrate SSES concept 1.2.3.1 Estimate threat movement rates and expected dwell times • Automated calculation of point-to-point distances and rates using model data (M,D) • Automated calculation of point-to-point distances and rates using database data (D) • Direct interface with GIS system (M,D) • Manual calculation and entry of distances and rates (P) • Software enabled editing of movement rates/costs (M,D) • - Only supports database approach • - - Unclear how distance / rate database would be populated initially -- if distance / rate data is generated with network model database implementation adds additional effort • - Need to re-calculate distances and rates if terrain map is modified • ++ Potentially shorter run times since distances and rates are pre-computed • -- Probably not executable within course timeframe • -- Do not currently have access to requisite GIS systems • - Not necessary to demonstrate SSES concept • -- Only supports manual approach • -- Does not support any type of automation • -- Excessive analyst workload • + Complementary with both model (directly) and database (indirectly) baseline approaches • + Provides additional flexibility and mechanism to incorporate analyst judgment • + Natural fit with partitioned terrain model and network representation • - Minor additional effort required to implement • - Additional effort required to use – depends on extent of analyst editing Anderson, Beres, Shaw, Valadez
SSES Function - Form Alternatives 1.2.3 FUNCTIONS FORMS ATTRIBUTES 1. Represent and assess site characteristics 1.2 Construct, display, and manipulate site models / analytic representations • + Can support both model (directly) and database (indirectly) approaches • o Only feasible if network based terrain and mobility representation is selected but could operate on either terrain model or database • ++ Allows fully automated identification and calculation of alternative paths • ++ Allows use of mature network analysis techniques -- Can leverage Matlab network BGL package • + Facilitates calculation of cumulative, path specific detection probabilities • - Potentially longer run times since feasible paths are computed for each run • + Readily supports with graphical display of distances and paths • ++ Good enough to demonstrate SSES concept • Network representation with shortest path algorithms (M,D) • Database look-up (D) • Tabular data look-up (P) 1.2.3.2 Identify feasible ingress and egress routes • - Only supports database approach • - - Unclear how ingress / egress database would be populated initially • + Requires additional effort if route database is populated using network based model • - Probably requires recalculation of ingress / egress routes if terrain map is modified • ++ Potentially shorter run times since ingress / egress routes are pre-computed • - - Only supports manual approach • - - Does not support any type of automation • - - Excessive analyst workload for use • - - As with database approach, it is not clear how tabular data would be generated initially Anderson, Beres, Shaw, Valadez
SSES Function - Form Alternatives 1.2.4 FUNCTIONS FORMS ATTRIBUTES 1. Represent and assess site characteristics 1.2 Construct, display, and manipulate site models / analytic representations 1.2.4 Save, recall, and manage site terrain models and data • Data management strategy will flow from selection of top-level approach and data structure design -- Defer selection pending decision on top level approach • Embedded model archive (M) • Internal database (M,D) • Off-line database (D,P) Anderson, Beres, Shaw, Valadez
SSES Function - Form Alternatives 2.1 FUNCTIONS FORMS ATTRIBUTES 2. Assess and represent projected / potential threat characteristics • - - Only supports manual approach • ++ Negligible effort required to implement • - - Highest analyst workload for operation • - - Does not support any type of automation • Manual threat classification (P) • Threat database (P,D,M) • Explicitly model threat characteristics without classification (M) 2.1 Classify threats based on their type and attributes • + Supports model, database, or manual processing approaches • ++ Simplest to implement – lookup mobility and sensor performance tables indexed by threat type / behavior • ++ Good enough to demonstrate prototype objectives • Only supports model based approach • + Supports highest fidelity modeling / analysis of sensor performance • ++ Probably required for full implementation of model based performance analysis • - - Level of effort required to build threat specific models probably not supportable given course timeline • - - We currently do not have access to intelligence data needed to model threat attributes directly • - Detailed threat attribute modeling is not critical to successful prototype demonstration Anderson, Beres, Shaw, Valadez
SSES Function - Form Alternatives 2.2.1 FUNCTIONS FORMS ATTRIBUTES 2. Assess and represent projected / potential threat characteristics 2.2 Obtain and manage threat classification and quantitative threat signature data • - - Only supports model based approach • - - Level of effort to design threat entity models and behavior likely to be significant – probably not executable within course timeline • - - SSES team currently lacks skills experience for entity design and programming • ++ Most flexible, and potentially most realistic modeling approach • ++ Area of ongoing research – academically interesting approach • - Not necessary to demonstrate SSES concept • Software entity models (M) • Threat data base entries (M,D,P) • Physical "toy soldier" models (P) 2.2.1. Represent threat types (e.g. personnel, wheeled vehicles, tracked vehicles, watercraft) and numbers • ++ Supports model, database, or manual processing approaches • ++ Simplest implementation – Implementation effort scales with the type and amount of data captured – can start simple and scale up • + Adequate to demonstrate SSES concept • - - Only supports manual approach • - - Does not support any type of automation Anderson, Beres, Shaw, Valadez
SSES Function - Form Alternatives 2.2.1 FUNCTIONS FORMS ATTRIBUTES 2. Assess and represent projected / potential threat characteristics 2.2 Obtain and manage threat classification and quantitative threat signature data • Only supports model based approach • + Supports highest fidelity modeling / analysis of sensor performance • + Probably required if fully model based sensor performance analysis is selected • - - Level of effort required to build threat specific signature models probably not supportable given course timeline • - - We currently do not have access to intelligence data needed to model threat signatures directly • - Detailed threat signature modeling is not critical to successful prototype demonstration • Explicit modeling of signatures and characteristics (M) • Database of signatures and characteristics for use in sensor models (M) • Implicitly represent in sensor-threat performance data (M,D,P) 2.2.2 Represent threat physical dimensions and visual / infra-red (IR) characteristics • - Only supports model based approach • - Only feasible where sensor performance models are available, or can be constructed • ++ Balances implementation complexity and modeling fidelity • + Threat signature data is decoupled from terrain, environment, and sensor data • ++ No deed to pre-compute sensor performance • ++ Good enough to demonstrate SSES concept 2.2.3 Represent threat radar cross section (RCS) Signature database + sensor model and implicit sensor performance database approaches are complementary not mutually exclusive – Intend to pursue both approaches 2.2.4 Represent threat radio-frequency (RF) emissions • ++ Supports model, database, or manual processing approaches • - Lowest fidelity / least flexible approach • ++ Simplest to implement (code) – lookup sensor performance based on threat type/behavior, terrain, and environment • - - Potentially high-dimensional: requires up-front calculation of sensor performance for all threat / sensor / terrain / environment combinations • = Good enough to demonstrate some but not all prototype objectives • - - Links threat characteristics with sensor, terrain and environment characteristics – must update performance database for any changes 2.2.5 Represent threat acoustic and seismic emissions including signature dependency on threat speed Anderson, Beres, Shaw, Valadez
SSES Function - Form Alternatives 2.3 FUNCTIONS FORMS ATTRIBUTES 2. Assess and represent projected / potential threat characteristics 2.3 Provide threat class and signature data to sensor performance models • ++ Minimizes analyst level of effort • ++ Supports automated modeling / analysis of sensor performance • + Probably required if fully model based sensor performance analysis is selected • - Moderate level of effort required to build threat – sensor model interfaces • Integrated sensor performance model interface (M,D) • Sensor performance model database & query tools (D) • Manual entry and calculation of sensor performance (P) • Only supports database based approach • - Significant level of effort required to populate database • - Potentially significant analyst level of effort depending on level of automation of database query tools • - - Only supports manual approach • - - Does not support any type of automation Anderson, Beres, Shaw, Valadez
SSES Function - Form Alternatives 2.4 FUNCTIONS FORMS ATTRIBUTES 2. Assess and represent projected / potential threat characteristics 2.4 Obtain and manage threat mobility data • - - Level of effort required to model threat mobility as a function of terrain type not supportable given course timeline • - - We lack intel data needed to model threat movement rates • - Detailed mobility modeling is not important to demonstrating prototype capabilities 2.4.1 Represent threat speed as a function of the type of terrain being traversed • Software terrain dependent threat mobility model (M) • Terrain dependent threat movement rate look-up tables (M, D) • Manual calculation of movement rates (P) • + Supports either model or database approach • ++ Simplest and computationally efficient approach • ++ Good enough to demonstrate prototype objectives • + Readily extensible to use model based approach in the future if desired • - - Only supports manual approach, does not allow any type of automation • - - Excessive workload 2.4.2 Represent prohibited terrain types which may not be traversed by specific classes / types of threat • Specify prohibitive threat / terrain dependent mobility network edge costs (M,D) • Specify prohibitive threat / terrain dependent database movement costs (M,D) • Maintain threat-terrain tabu list (M,D, P) • + Supports either model (directly) or database (indirectly) approach • ++ Simple to implement – can incorporate directly into movement cost tables / functions • Concept is similar for both model and database approaches but implementation will depend on choice of model or database • - Requires additional effort to generate and check tabu list • - No obvious advantage over use of punitive network edge costs 2.4.3 Represent mobility effects of barriers and obstacles • Add obstacle /barrier cost to terrain partitions and / or partition edges (M, D, P) • + Only identified solution Anderson, Beres, Shaw, Valadez
SSES Function - Form Alternatives 2.5 FUNCTIONS FORMS ATTRIBUTES 2. Assess and represent projected / potential threat characteristics 2.5 Represent threat objectives, behaviors and operating constraints • - - Only supports manual approach, does not allow any type of automation • - - Excessive workload for analyst • ++ Easy to incorporate analyst expertise and judgment regarding 2.5.1 Represent threat intrusion objectives • Manually specify threat movement paths (P) • Specify objectives as sink nodes for network flow / shortest path algorithms (M, D) • + Supports either model (directly) or database (indirectly) approaches • + Simple and computationally efficient • + Consistent with network based mobility modeling approach • + Allows selection of single or multiple objectives (targets) • - Does not provide a mechanism to incorporate analyst expertise and judgment beyond selection of geographic objectives 2.5.3 Represent threat survivability / escape objectives • Manually specify threat movement paths (P) • Specify both objectives and egress points as sink nodes for two part network flow / shortest path algorithms (M,D) • Specify tabu points / regions based on actual or perceived detection probabilities (M,D) • Maintain threat-terrain tabu list (M,D) • On further review use of tabu data appears to be complementary with and an extension of network flow modeling approach rather than a fully functional alternative -- consider use if source –sink selection combined with movement network does not provide satisfactory results • + Supports either model (directly) or database (indirectly) approaches • + Simple implementation by incorporating covertness posture / behavior into movement and detection data – e.g. covert threat has lower Pd and lower movement rate for given terrain 2.5.2 Represent threat covertness posture • Include behaviors as part of threat characterization data / algorithms (M,D) • Dynamically modify signatures and characteristics based on behavior • - More complex to implement • - Not needed to demonstrate prototype objectives • - Not feasible if lookup table approach is selected for movement / sensor performance Anderson, Beres, Shaw, Valadez
SSES Function - Form Alternatives 2.6 FUNCTIONS FORMS ATTRIBUTES 2. Assess and represent projected / potential threat characteristics 2.6 Provide mobility and behavior data to threat route planning, and performance assessment functions - Only supports model based approach ++ Minimizes analyst workload – data is provided automatically + Complementary with network based terrain representation - Significant effort required to design and code, but supportable within project timeframe • Integrated design environment with direct interfaces (M) • Database query or software enabled manual data import / export (M,D) • Manual data import / export (P) • Intend to pursue hybrid approach: Maintain external database(s) of threat mobility, behavior, and signature data; have analyst select database and load data into SSES initially; then use internal data to feed SSES models. Matab-Excel interface is relatively slow and direct operation on externally saved data will result in significant run-time increase • + Supports model based or database approaches • - Increased analyst workload: • – Small increase if manual action required to load data initially • - - Prohibitive if manual action required to export/distribute data • for route planning and performance assessment functions • ++ Addresses stakeholder interest item • o Moderate effort required to design and code, largely shared if other database functionality is implemented • - - Only supports manual approach, does not allow any type of automation • - - Excessive workload for analyst Anderson, Beres, Shaw, Valadez
SSES Function - Form Alternatives 3.1 FUNCTIONS FORMS ATTRIBUTES 3 Develop ESS designs and assess technical performance 3.1 Obtain, display, and manage attribute and performance data on for individual sensor system elements • + Supports model, database , and manual approaches • - Moderate level of effort required to build integrated editing capability in SSES application • + Good enough for proof-of-concept demo • Manual entry and management of sensor specifications and performance (M, D,P) • Software supported import of sensor specifications and performance data (M,D,P) • Web based query of vendor sensor specs & performance (D,M) 3.1.1 Maintain a list/data base of available sensors • + Supports either model driven or database approaches • ++ Addresses stakeholder interest item • ++ Allows external editing of performance data • + Moderate level of effort required to implement sensor spec import functionality – effort required is probably less than that required to implement integrated editing capability • + Good enough for proof-of-concept demo • + Supports model or database approaches • - - Potentially significant effort required to implement web access tools • - Currently do not have “live” partner for sample sensor data • - - Not necessary to demonstrate SSES concept Anderson, Beres, Shaw, Valadez
SSES Function - Form Alternatives 3.1 FUNCTIONS FORMS ATTRIBUTES 3 Develop ESS designs and assess technical performance 3.1 Obtain, display, and manage attribute and performance data on for individual sensor system elements • - Only supports model based approach • ++ Allows highest fidelity modeling of sensor performance • Do not currently have analytic models for all candidate sensor types • + Do have analytic models for some sensor types • - Potentially high level of effort to implement sensor models – expect effort to depend on number of different sensor class models implemented 3.1.2 Model/represent sensor nominal Pd as a function of threat type/signature and terrain type • Physics / engineering based sensor performance model (M) • Sensor performance database (M,D) • Hardcopy sensor performance tabular data (P) Engineering model and sensor performance database approaches are complementary not mutually exclusive – Intend to implement a few sensor models for proof-of-concept, and use externally generated performance databases for most candidate sensors 3.1.3 Model/represent sensor nominal effective range as a function of threat type/signature and terrain type • + Supports either database (directly) or simplified model (i.e. lookup table data becomes the model) approaches • + Simplest to implement • + Medium-to-low fidelity analysis approach, can be mitigated if high fidelity models are used to populate database, and multiple factors are considered when accessing the data • - Do not have performance data for all candidate sensor types and threats • + Can easily generate “illustrative” data sets for demonstration purposes 3.1.4 Model/represent sensor nominal false alarm rate • - - Only supports manual approach, does not allow any type of automation • - - Excessive workload for analyst Anderson, Beres, Shaw, Valadez
SSES Function - Form Alternatives 3.1 FUNCTIONS FORMS ATTRIBUTES 3 Develop ESS designs and assess technical performance 3.1 Obtain, display, and manage attribute and performance data on for individual sensor system elements • - Only supports model based approach • ++ Allows highest fidelity modeling of sensor performance • Do not currently have analytic models for all candidate sensor types • + Do have analytic models for some sensor types • - Potentially high level of effort to implement sensor models – expect effort to depend on number of different sensor class models implemented • Incorporate directly into physics / engineering based sensor performance model (M) • Incorporate directly into sensor performance database values / tabular data (M,D) • Apply environment dependent correction factor to performance determined by model / database lookup (M,D,P) 3.1.5 Model/represent sensor susceptibility to environmental effects and the effect of environment on Pd, effective range and FAR Considerations for incorporation of environmental effects are essentially the same as for the basic model vs. database selection. For sensor classes where a model is developed it makes sense to incorporate environmental factors into the model. For sensors that use externally generated performance databases environmental factors will be incorporated into the database. • + Supports either database (directly) or simplified model (i.e. lookup table data becomes the model) approaches • + Simplest to implement • + Medium-to-low fidelity analysis approach, can be mitigated if high fidelity models are used to populate database, and multiple factors are considered when accessing the data • - Do not have performance data for all candidate sensor types and threats • + Can easily generate “illustrative” data sets for demonstration purposes • - No readily available source of performance correction factor data • - No obvious advantage over database approach since correction factors can simply be applied to the database data Anderson, Beres, Shaw, Valadez
SSES Function - Form Alternatives 3.1 FUNCTIONS FORMS ATTRIBUTES 3 Develop ESS designs and assess technical performance 3.1 Obtain, display, and manage attribute and performance data on for individual sensor system elements • + Supports either model or database approach • + Relatively simple to implement explicit field-of-view test • + Complementary with line-of-sight calculations • + Allows most accurate representation of sensors with restricted FoV (e.g. CCTV) 3.1.6 Model/represent sensor field-of-view (azimuth and elevation limits) • Represent explicitly (M) • Incorporate into Pd performance data (M,D,P) • - - The team has been unable to come up with a generalized approach to incorporating field-of-view into detection performance. Aligns with the model vs. database decision for particular sensor classes. For sensor classes where a model is developed it is straightforward to incorporate scan times factors explicitly into the model. For sensor “models” that rely on a performance database scan times will be subsumed into the performance data • Represent explicitly (M) • Incorporate into Pd performance data (M,D,P) 3.1.7 Model/represent sensor scan / revisit times Anderson, Beres, Shaw, Valadez Continued on next slide
SSES Function - Form Alternatives 3.1 (cont) FUNCTIONS FORMS ATTRIBUTES 3 Develop ESS designs and assess technical performance 3.1 Obtain, display, and manage attribute and performance data on for individual sensor system elements • + Supports either model or database approach • + Relatively simple to implement – minimal additional effort to add cost data for sensors that use external spec / performance database • ++ Allows automated / integrated cost estimation • + Could be extended to automated generation of installation plans / specs in follow on system • Electronic sensor support requirement database (M,D) • Hardcopy sensor support requirement tabular data (P) 3.1.8 Represent sensor support requirements including electrical power, communications / connectivity mechanisms, and interfaces 3.1.9 Represent sensor cost data including procurement, installation, and life-cycle operations and support costs • - - Only supports manual approach, does not allow any type of automation • - No reduction in analyst / designer workload Anderson, Beres, Shaw, Valadez
SSES Function - Form Alternatives 3.2.1 FUNCTIONS FORMS ATTRIBUTES 3 Develop ESS designs and assess technical performance 3.2 Select, place, assess, and display the performance of individual sensors Specific interface mechanism does not impact overall SSES architecture given development environment approach is selected -- both approaches work. Defer pending assessment of GUI “real estate” available. 3.2.1 Select sensors from list of available sensors • Manually select from pull down menu in development environment (G) • Manually select by drag-and-drop in development environment (G) • Manually select via database query (D) • - Only supports model based approach • + Moderate level of effort to implement manual selection and placement controls • ++ Provides intuitive, user friendly interface approach • + Minimum functionality for useful proof-of-concept demonstration • + Same controls used for manual selection and editing can be leveraged for approval / editing of automatically generated plans 3.2.1.1 Manually select sensors • - Only supports database approach • - May require database skills not currently available in current workforce • - Increased workload relative to GUI approach 3.2.1.2 Recommend sensors for manual selection • Same as 3.2.1.2. below, but with manual acceptance and editing Anderson, Beres, Shaw, Valadez
SSES Function - Form Alternatives 3.2.1 FUNCTIONS FORMS ATTRIBUTES No clear winner at this point. At a minimum, intend to implement rule based approach with option to trade us after remaining SSES functionality and architecture have been established and tested. 3 Develop ESS designs and assess technical performance 3.2 Select, place, assess, and display the performance of individual sensors • + Conceptually simplest approach • + Potentially easiest to develop and code • + Low expected processing time • - Depends on ability to generate broadly applicable selection heuristic – not a given • - Solutions not provably optimal • + Minimum requirement for successful proof-of-concept demonstration 3.2.1.3 Automatically select sensors • Rule based expert system (M,D) • Greedy set covering algorithms (M) • Network flow / spanning tree algorithms (M) • Dynamic programming algorithms (M) • Stochastic design using genetic algorithms or simulated annealing (M) • + Conceptually relatively simple approach • o Moderate effort to develop and code • - Solutions will generally not be optimal, and may be relatively poor • - More complicated algorithm • - Higher level of effort to develop and code • + May be complementary with, and able to leverage network based terrain and movement representations • o Processing demand is unclear • o Not clear whether generated solutions will be provably optimal • - More complicated algorithm • - Significantly higher level of effort to develop and code • - Potentially very high processing demand for larger designs unless combined with heuristic that can reduce selection space • ++ Can produce provably optimal solutions • - Significantly more complicated algorithm • - - Significantly higher level of effort to develop and code, probably not executable within project timeframe • ++ Scalable processing demand, i.e. can find “best” solution for given analysis budget • ++ Can produce multiple “good” solutions • ++ Complementary with other potential solutions Anderson, Beres, Shaw, Valadez
SSES Function - Form Alternatives 3.2.2 FUNCTIONS FORMS ATTRIBUTES 3 Develop ESS designs and assess technical performance 3.2 Select, place, assess, and display the performance of individual sensors • - Supports model approach only • + Faster and easier than numeric / text editing • + Intuitive approach familiar to most computer users • + Can provide direct visual feedback on sensor coverage • - May offer less explicit control of sensor placement & orientation than direct editing 3.2.2 Position and orient sensors • Drag sensor position / orientation in development environment (G+M) • Manually edit sensor position / orientation in development environment (G+M) • Manually edit sensor position / orientation in database (D) 3.2.2.1 Manually position and orient sensors Drag & drop and editing are complementary not mutually exclusive – may use both with drag & drop for gross positioning and editor for fine tuning • - Supports model approach only • - More time consuming than drag & drop • - Does not provide direct visual feedback on sensor coverage • + Provides more explicit control of sensor placement & orientation • - Supports database approach only • - Does not provide direct visual feedback on sensor coverage • + Only apparent option if database approach is selected 3.2.2.2 Recommend sensors for manual selection • Integrated into 3.2.1.3 functionality Anderson, Beres, Shaw, Valadez
SSES Function - Form Alternatives 3.2.3.1 FUNCTIONS FORMS ATTRIBUTES 3 Develop ESS designs and assess technical performance 3.2 Select, place, assess, and display the performance of individual sensors 3.2.3 Assess and display sensor coverage and detection performance • Physics / engineering based sensor performance model (M) • Sensor performance database (D) • Hardcopy sensor performance tabular data (P) 3.2.3.1 Model emplaced sensor detection performance See discussion of functions 3.1.2, 3.1.3, 3.1.4 – Intend to implement a few sensor models for proof-of-concept, and use externally generated performance databases for most candidate sensors • - - Only supports manual approach, does not allow any type of automation • - - Excessive workload for analyst • - Supports model approach only • + Native format of DTED / DEM data is elevation grid • ++ Matlab mapping toolbox includes line-of-site calculation function that operates on grid data • Automatic LOS calculation based on terrain elevation grid & feature data (M) • Automatic LOS calculation based on terrain facet & feature data (M) • Database LOS lookup (M,D) 3.2.3.1.1 Calculate sensor-to-target LOS • - Supports model approach only • Additional effort required to design and code facet based line-of-sight calculation • May be lower resolution than grid data depending on the size of terrain faces vs grid spacing • o Potentially faster or significantly slower than grid based line-of-sight calculation depending on ability to limit number of faces tested • + Could support either database or model approach • Does not resolve issue of how line-of-sight is calculated initially • - - Significant up-front cost to calculate line-of-sight data, potentially prohibitive storage requirement for large terrain maps • + Potentially faster in execution Anderson, Beres, Shaw, Valadez
SSES Function - Form Alternatives 3.2.3.1 FUNCTIONS FORMS ATTRIBUTES 3 Develop ESS designs and assess technical performance 3.2 Select, place, assess, and display the performance of individual sensors 3.2.3 Assess and display sensor coverage and detection performance • o Although automated propagation path calculation can be implemented for both a model based or database based approach, it is effectively only applicable to sensors whose performance will be modeled • + Relatively straightforward to model signal attenuation as a function of range and terrain type • + Can leverage line-of-sight algorithms • + Lowest workload on analyst / designer 3.2.3.1.2 Determine target-to-sensor propagation path losses • Automatic propagation path / path loss calculation based on terrain model / database (M,D) • Database path/path loss look-up (D) • Manual calculation and entry of path losses (P) • + Could support either database or model approach • Does not eliminate need for model to perform initial propagation path / loss calculation • - - Significant up-front cost to calculate loss data, potentially prohibitive storage requirement for large terrain maps • + Potentially faster in execution • - - Only supports manual approach, does not allow any type of automation • - - Prohibitive workload for analyst • + Supports either model or database approach • + Relatively simple to implement explicit field-of-view test • + Complementary with line-of-sight calculations • + Allows most accurate representation of sensors with restricted FoV (e.g. CCTV) • Incorporate azimuth and elevation and field-of-view limits directly into physics / engineering based sensor performance model (M) • Incorporate azimuth and elevation and field-of-view limits into sensor performance data (M,D) 3.2.3.1.3 Determine sensor azimuth and elevation coverage • - - The team has been unable to come up with a generalized approach to incorporating field of view into detection performance. Considerations are the same as for 3.1 6 Anderson, Beres, Shaw, Valadez
SSES Function - Form Alternatives 3.2.3.1 (cont) FUNCTIONS FORMS ATTRIBUTES 3 Develop ESS designs and assess technical performance 3.2 Select, place, assess, and display the performance of individual sensors 3.2.3 Assess and display sensor coverage and detection performance • Incorporate terrain type factors directly into physics / engineering based sensor performance model (M) • Incorporate terrain type into sensor performance database values / tabular data (D) • Apply terrain dependent correction factor to performance determined by model / database lookup (M,D,P) 3.2.3.1.4 Calculate terrain type effects on sensor performance See discussion of functions 3.1.2 – Intend to model terrain factors directly for sensors that are modeled explicitly and represent terrain effects via performance data for other sensors. 3.2.3.1.5 Adjust sensor performance for environmental effects • Incorporate environmental factors directly into physics / engineering based sensor performance model (M) • Incorporate environment into sensor performance database values / tabular data (D) • Apply environment dependent correction factor to performance determined by model / database lookup (D,P) See discussion of functions 3.1.5– Intend to model environmental factors directly for sensors that are modeled explicitly and represent environmental effects via performance data for other sensors. + Supports model based or database approaches ++ Low up-front cost and minimal storage requirement - Potentially slower in execution 3.2.3.1.6 Calculate Pd at discrete points as a function of sensor, threat, terrain, and environmental conditions • + Supports database approach only • - - High up-front calculation cost and high storage requirement • - - May need to recalculate all database values each time sensor selection / placement / orientation is changed • Perform on-demand Pd calculations / data lookup (M,D) • Pre-calculate point-to-point Pd values and populate database (D) • Manually calculate Pd performance (P) • - - Only supports manual approach, does not allow any type of automation • - - Excessive workload for analyst Anderson, Beres, Shaw, Valadez
SSES Function - Form Alternatives 3.2.3.1 (cont) FUNCTIONS FORMS ATTRIBUTES 3 Develop ESS designs and assess technical performance 3.2 Select, place, assess, and display the performance of individual sensors 3.2.3 Assess and display sensor coverage and detection performance • + Supports database approach only • - - High up-front calculation cost and high storage requirement • - - May need to recalculate all database values each time sensor selection / placement / orientation is changed • Pre-calculate area aggregate Pd values and populate database (D) • Manually calculate aggregate area Pd performance (P) • Sample Pd data over a grid and aggregate results (M) • Stochastically sample Pd data at random points and compute expected values (M) 3.2.3.1.7 Calculate aggregate Pd for designated areas as a function of sensor, threat, terrain, and environmental conditions • - - Only supports manual approach, does not allow any type of automation • - - Excessive workload for analyst • - Supports model based approach only • ++ Straightforward to implement – basically just involves performing point-to-point detection calculation for multiple points and aggregating results Decision to sample over regular grid vs random gird does not impact SSES architecture – will try both and select approach with better execution time and accuracy 3.2.3.1.8 Calculate sensor internally and externally generated false alarm rates • Physics / engineering based sensor false alarm model (M) • Sensor false alarm database (D) • Hardcopy sensor false alarm tabular data (P) See discussion of functions 3.1.2, 3.1.3, 3.1.4 and 3.2.3.1 considerations for false alarm modeling are basically the same as for Pd modeling – Intend to implement false alarm models for the same sensors that use Pd models, and use false alarm databases for sensors that use Pd database Anderson, Beres, Shaw, Valadez
SSES Function - Form Alternatives 3.3.1 FUNCTIONS FORMS ATTRIBUTES 3 Develop ESS designs and assess technical performance 3.3 Construct, assess, and display the performance and cost of sensor suites 3.3.1 Construct sensor networks from individual sensors 3.3.1.1 Manually select and position sets of sensors ++ Applicable to model based, database, and manual approaches ++ Lowest development and coding effort + Minimum capability required for successful proof of concept demonstration - Provides least reduction in analyst / designer workload • Direct manual selection and placement (G+M, D, P) • Manual selection and placement by rule (G+M,D) • Manually select sensor type, with auto placement (G+M,D) Major challenge is identification and validation of suitable heuristics for sensor selection and placement – choice of heuristic is not expected to drive architecture so defer this decision until basic functionality for manual placement has been developed • Heuristic fill-in of manually seeded sensors (M,D) • Dynamic programming algorithms (M) • Spanning tree / network flow algorithms (M) 3.3.1.2 Heuristically select and position sets of sensors - Applicable to model based approach only + Conceptually relatively straightforward, and easy to code - - Potentially very high computation costs for sites/designs with large number of terrain faces or sensors + Applicable to model based approach only + Complementary with network algorithms for route planning and min / max vulnerability routes + Can leverage Matlab BGL network analysis tools • Shortest path / spanning tree algorithms (M) • Manually connect sensors (M,D,P) • Bayesnet algorithms (M) • Colored Petri Net algorithms (M) ++ Applicable to model based, database, and manual approaches ++ Lowest development and coding effort + Minimum capability required for successful proof of concept demonstration - Provides least reduction in analyst / designer workload 3.3.1.3 Form sensor networks - Do not yet have a clear vision of how Bayesnet or CPN algorithms would be implemented Anderson, Beres, Shaw, Valadez
SSES Function - Form Alternatives 3.3.2 FUNCTIONS FORMS ATTRIBUTES 3 Develop ESS designs and assess technical performance 3.3 Construct, assess, and display the performance and cost of sensor suites Two distinct issues must be addressed: 1) connectivity between multiple sensors and monitoring site , and 2) sensor data fusion 3.3.2 , Assess sensor suite coverage, detection performance and cost • + Applicable to model based and database approaches • Only addresses sensor connectivity • + Lowest development and coding effort • + Readily supports network routing and cost estimation • + Minimum capability required for successful proof of concept demonstration • + Only alternative identified so far 3.3.2.1 Represent the integration of the outputs of multiple sensors in various architectures • Min cost flow (M,D) • + Simple algorithm with low development and coding effort • Takes simplistic view of sensor fusion, unlikely to capture important details • + Meets minimum objective for proof-of-concept demonstration 3.3.2.2 Apply alternative sensor fusion rules • Primary sensor with confirmation (M,D) • Voting algorithms (M,D) • Bayesian classification algorithms (M,D) • Colored petri-net (M,D) + Relatively simple algorithm with manageable development and coding effort o Able to capture some additional sensor fusion details - More complex algorithm with higher development and coding effort – may not be executable within project timeframe + Allows more sophisticated assessment of sensor fusion – provides growth path for follow-on system + Supports robust proof-of-concept demonstration 3.3.2.3 Determine sensor suite fused Pd for discrete points as a function of sensor, threat, terrain, and environment - - Potentially much greater development and coding effort – probably not be executable within project timeframe - - Team lacks CPN development background ++ Most flexible / highest fidelity modeling approach – provides best growth path for follow-on system + Not necessary for successful proof-of-concept demo • Done via application of algorithms in 3.3.2.2 to specific sensor-target geometries Anderson, Beres, Shaw, Valadez
SSES Function - Form Alternatives 3.3.2 FUNCTIONS FORMS ATTRIBUTES 3 Develop ESS designs and assess technical performance 3.3 Construct, assess, and display the performance and cost of sensor suites 3.3.2 , Assess sensor suite coverage, detection performance and cost + Simplest approach + Essentially no additional development and coding effort over basic Pd algorithm - - May provide inaccurate aggregate Pd estimates for large terrain faces / if Pd varies significantly within face + Meets basic requirement for proof-of-concept demo • Represent area Pd by terrain face centroid point-to-point Pd (M,D) • Aggregate point-to-point results over regular grid (M,D) • Use expected value of Monte Carlo point-to-point results (M,D) 3.3.2.4 Determine sensor suite aggregate fused Pd for designated areas as a function of sensor, threat, terrain, and environment o Small additional development and coding effort over basic Pd algorithm ++ Can provide accurate aggregate Pd estimates for large terrain faces and for cases where Pd varies significantly within face ++ Can be used to trigger prompt to analyst / designer to subdivide terrain faces if large variation in Pd exists Decision to sample over regular grid vs random gird does not impact SSES architecture – will try both and select approach with better execution time and accuracy 3.3.2.5 Determine fused false alarm rate for the sensor suite for alternative sensor fusion rules • Incorporate into 3.3.2.2 algorithms Anderson, Beres, Shaw, Valadez
SSES Function - Form Alternatives 3.3.3 FUNCTIONS FORMS ATTRIBUTES 3 Develop ESS designs and assess technical performance 3.3 Construct, assess, and display the performance and cost of sensor suites 3.3.3 Display sensor suite coverage and detection performance + Best fit for GUI based approach ++ Low marginal design and coding effort provided point-to-point Pd calculation has been implemented + Can leverage same network data structures used for terrain partitioning and movement calculations • Interactive multi-sensor Pd display in development environment (G+M) • Multi-sensor Pd database query tools (D) • Manual calculation and display of multi-sensor Pd (P) 3.3.3.1 Display sensor suite Pd for specific points - Only applicable to database approach - Requires significant effort to assess Pd for multiple points - Potentially prohibitive calculation and storage requirements • - - Only supports manual approach, does not allow any type of automation • - - Excessive workload for analyst + Best fit for GUI based approach ++ Provides best support for visualization and comprehension ++ Easy to display and recognize coverage gaps + Can leverage same network data structures used for terrain partitioning and movement calculations • Color coded Pd map overlays in development environment (G) • Database query Pd numeric data (D) • Database query Pd plot data (D) • Multi-layer manual map overlays (P) 3.3.3.2 Display sensor suite Pd for designated areas 3.3.3.3 Display sensor coverage by sensor and type - Only applicable to database approach - Requires significant effort to assess Pd for multiple points - Potentially prohibitive calculation and storage requirements 3.3.3.4 Display sensor coverage gaps and blind spots • - - Only supports manual approach • - - Significant effort required to prepare and position overlays for evolving sensor suite design Anderson, Beres, Shaw, Valadez
SSES Function - Form Alternatives 3.3.3 FUNCTIONS FORMS ATTRIBUTES 3 Develop ESS designs and assess technical performance 3.3 Construct, assess, and display the performance and cost of sensor suites 3.3.3 Display sensor suite coverage and detection performance • Same as 3.3.3.3 - Only applicable to database approach - Requires significant effort to assess Pd for multiple points - Potentially prohibitive calculation and storage requirements • Sensor false alarm numeric data (M, D, P) • Sensor false alarm frequency plots / histograms (M,D,P) 3.3.3.5 Display sensor suite false alarm rate + Best fit for GUI based approach ++ Low marginal design and coding effort provided point-to-point Pd calculation has been implemented + Can leverage same network data structures used for terrain partitioning and movement calculations Anderson, Beres, Shaw, Valadez
SSES Function - Form Alternatives 3.3.1 FUNCTIONS FORMS ATTRIBUTES 3 Develop ESS designs and assess technical performance 3.4 Construct, assess, and display the performance and cost of sensor suites + Best fit for GUI based approach ++ Low design and coding effort + Lowest workload for analyst / designer – costs are updated automatically when design changes + Can leverage same network data structures used for terrain partitioning and movement calculations • Integrated cost estimation tool in development environment (G) • Integrated cost estimation tool in database (D) • Automatically populated cost estimation spreadsheet (G,D) • Manually populated cost estimation spreadsheet (GD,P) • Manual cost estimation from tabular / catalogue data (P) 3.4.1 Estimate cost - Only applicable for database approach + Straightforward to implement + Applicable to both GUI and database approaches ++ Low marginal effort to generate cost spreadsheets once cost data is generated + Reduced workload for analyst / designer - - Excessive workload for analyst • - - Only supports manual approach, does not allow any type of automation • - - Excessive workload for analyst Anderson, Beres, Shaw, Valadez
SSES Function - Form Alternatives 3.5 FUNCTIONS FORMS ATTRIBUTES 3 Develop ESS designs and assess technical performance 3.5 Optimize ESS designs + Best fit for GUI based approach + Lowest analyst effort to manage designs + Permits juxtaposition of performance metrics and design data + Relatively low effort required to design and code • Embedded database (M,D) • Off-line database (M,D,P) • Manual tabulation and management of data (P) 3.5.1 Store, recall, and manage ESS designs and associated performance metrics + Supports any approach - Additional effort required to design and manage off line database • - - Only supports manual approach, does not allow any type of automation • - - Excessive workload for analyst 3.5.2 Manually perform, ESS design iterations, and compare results • Manual design and assessment with integrated comparison tools in development environment (G) • Manual design and assessment with integrated comparison tools in database (D) • Manual design and assessment with off-line comparison of designs (P) + Best fit for GUI based approach + Lowest analyst effort to manage designs + Permits juxtaposition of performance metrics and design data + Relatively low effort required to design and code - Only supports database approach - Additional effort required to design and manage off line database as well as building comparison tools • - - Only supports manual approach, does not allow any type of automation • - - Excessive workload for analyst • Automatic implementation of manually developed heuristics (M,D) • Dynamic programming algorithms (M,D) • Greedy set covering (M) • Simulated annealing (M) • Genetic algorithms (M) 3.5.3 Heuristically perform, ESS design iterations, and compare results • Do not yet have a clear vision of how to do this, particularly the expected level of effort to develop and code the design heuristic Anderson, Beres, Shaw, Valadez