Download
1 / 33
330 likes | 440 Views
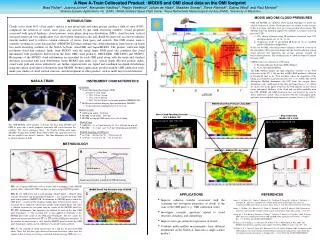
Global free t ropospheric NO 2 Abundances Derived using a Cloud Slicing Technique from Aura OMI. S. Choi, J. Joiner, Y. Choi, B. N. Duncan, and E. J. Bucsela OMI Science Team Meeting 2014. 3. 13. Outline. Background Cloud slicing technique

E N D
Global free tropospheric NO2 Abundances Derived using a Cloud Slicing Techniquefrom Aura OMI S. Choi, J. Joiner, Y. Choi, B. N. Duncan, and E. J. Bucsela OMI Science Team Meeting 2014. 3. 13.
Outline • Background • Cloud slicing technique • Evaluation of cloud slicing technique in conjunction with INTEX-B data • Global seasonal climatology of free tropospheric NO2 • Profile analysis • Stratospheric column NO2 OMI Science Team Meeting 2014
Free Tropospheric NO2 • Atmospheric NO2 • Produced by combustion, lightning, and in soil • Affects air quality - affects ozone production and criteria pollutant itself • Indirect radiative impacts in troposphere • Ozone has largest warming effect in upper-troposphere • Impacts methane concentrations • Tropospheric vertical column densities (VCD) of NO2 are available from satellites (GOME, OMI, SCIAMACHY,GOME-2) • No profile information • A few types offree-tropospheric NO2measurements available • Aircraft in situ measurements, MAX-DOAS, NO2sondes, etc. OMI Science Team Meeting 2014
Cloud Slicing Technique • Utilize above-cloudNO2column (where CRF > 0.9) • Good quality column measurements as clouds provide bright surface • Usually neglected in the view of surface pollution • Data obtained • Free tropospheric NO2 volume mixing ratio (VMR) • Stratospheric column NO2 • Independent of • A priori information • Prescribed stratospheric column estimate OMI Science Team Meeting 2014
Cloud Slicing Technique Measurement at Cloudy Scenes Observed Column vs Pressure • NO2VMR • = *kB*g/Rair Top of Atmosphere(TOA) 0 TOA Cloud scene pressure (hPa) Cloud scene pressure ΔP ΔVCD Ground Ground ~1013 NO2 VCD above the clouds OMI Science Team Meeting 2014 dVCD dP
Cloud Slicing Technique Measurement at Cloudy Scenes Observed Column vs Pressure • NO2VMR • = *kB*g/Rair Top of Atmosphere(TOA) 0 TOA Cloud scene pressure (hPa) Cloud scene pressure ΔP ΔVCD Ground Ground ~1013 NO2 VCD above the clouds OMI Science Team Meeting 2014 The slope between NO2 VCD and cloud pressure is proportional to NO2 volume mixing ratio (VMR) dVCD dP
Cloud Slicing Technique Measurement at Cloudy Scenes Observed Column vs Pressure Top of Atmosphere(TOA) 0 TOA Tropopause Pressure Cloud scene pressure ΔP ΔVCD Ground Strat NO2 VCD (above-tropopause column) Ground ~1013 Extended linear fit to the tropopausegives an estimate of stratospheric column OMI Science Team Meeting 2014
Cloud Slicing Technique • Assumptions • Uniform NO2 VMR in the sampling pressure ranges • No stratospheric variation in the sampling spatial/temporal ranges (6ox 8o, calculated per orbit) • Limitations • Represent cloudy conditions only • Magnitudes only as accurate as above-cloud NO2 VCD • SCD may be overestimated up to ~30% in current study OMI Science Team Meeting 2014
Comparison with INTEX-B Data A case near Houston, TX Reasonable agreement with positive bias (~35%) OMI Science Team Meeting 2014
Comparison with INTEX-B Data A case over northeast Pacific Reasonable agreement with positive bias (~35%) OMI Science Team Meeting 2014
Evaluation of Cloud Slicing NO2 VMR All available matchups No correlation Similar magnitude with positive bias OMI Science Team Meeting 2014
Evaluation of Cloud Slicing NO2 VMR • INTEX-B VMR standard error < 5 pptv • Weak correlation and positive bias • Reasonable agreement despite the intrinsic limits: • Poor collocation, small scale features, clear/cloudy conditions OMI Science Team Meeting 2014
Global Seasonal Climatology • Global seasonal free-tropospheric NO2 climatology • Take advantage of high spatial/temporal coverage of satellite measurements • Concentrate on spatial and seasonal patterns • Large volume of data required for reasonable results • 3-year OMI data accumulated (2005-2007) • Coarse resolution (6o latitude x 8o longitude) • Distinct patterns in the free tropospheric VMR • Independent source of data to study free troposphere OMI Science Team Meeting 2014
Global Seasonal Climatology OMI Science Team Meeting 2014 OMNO2B
Global Seasonal Climatology Different spatial patterns from tropospheric column OMI Science Team Meeting 2014 OMNO2B
Global Seasonal Climatology Appears to be anthropogenic contributions (uplifted pollution & outflow) OMI Science Team Meeting 2014 OMNO2B
Global Seasonal Climatology Appears to be lightning contributions (dominates during summer months) OMI Science Team Meeting 2014 OMNO2B
Global Seasonal Climatology OMI Science Team Meeting 2014 OMNO2B
Global Seasonal Climatology Appears to be anthropogenic contributions (uplifted pollution & outflow) OMI Science Team Meeting 2014 OMNO2B
Global Seasonal Climatology Appears to be lightning contributions (dominates during summer months) OMI Science Team Meeting 2014 OMNO2B
Profile Analysis • Coarse profile analysis (~100 hPa resolution) • Requires even more data with significant cloud pressure variability • Two example cases • East Asia and its outflow for anthropogenic NO2 • Tropical oceans of NH and SH for lightning NO2 OMI Science Team Meeting 2014
Profile Analysis High NO2 at 600-800 hPa OMI Science Team Meeting 2014
Profile Analysis OMI Science Team Meeting 2014
Profile Analysis OMI Science Team Meeting 2014
Profile Analysis High NO2 above 500 hPa in summer OMI Science Team Meeting 2014
Estimates of Stratospheric Column NO2 Estimate from cloud slicing agrees very well with independently derived estimates from OMNO2B – provides further confidence in derived free-tropopshericVMRs OMI Science Team Meeting 2014
Conclusions • Free tropospheric NO2 VMR derived using cloud slicing • Global seasonal climatology shows anthropogenic and natural (lightning) features of free tropospheric NO2, independent of the tropospheric column • Profile analysis shows uplifted anthropogenic NO2 in the middle troposphere as well as lightning NO2 in the upper troposphere • Estimated stratospheric column NO2 agrees well with independent stratospheric NO2estimates • Expect collaborations with free tropospheric NO2 measurements including NO2sondes OMI Science Team Meeting 2014
Thank you S. Choi et al.: Global free tropospheric NO2 Abundances Derived using a Cloud Slicing Technique from Aura OMI, Atmos. Chem. Phys. Discuss., 2013
Backup slides OMI Science Team Meeting 2014
Detail/Data Screening Criteria Use slant column density (OMNO2A) and geometric AMF Cloud radiance fraction > 0.9 Aerosol index < 1.0 No snow/ice surface Solar zenith angle < 80 degree Gradient of NO2 VMR < 0.33 pptv / hpa(profiles from GMI model or INTEX-B measurements) OMI Science Team Meeting 2014
Example of Calculated NO2 Climatology OMI Science Team Meeting 2014
Free Trop. NO2 VMR (OMI vs GMI) OMI GMI OMI Science Team Meeting 2014
Tropospheric Column NO2 (OMI vs GMI) OMI GMI OMI Science Team Meeting 2014