Download
1 / 1
10 likes | 158 Views
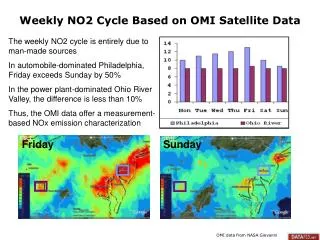
A New A-Train Collocated Product : MODIS and OMI cloud data on the OMI footprint Brad Fisher 1 , Joanna Joiner 2 , Alexander Vasilkov 1 , Pepijn Veefkind 3 , Johan de Haan 3 , Maarten Sneep 3 , Steve Platnick 2 , Galina Wind 1 and Paul Menzel 4

E N D
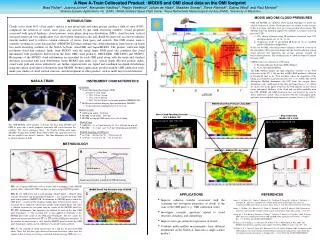
A New A-Train Collocated Product : MODIS and OMI cloud data on the OMI footprint Brad Fisher1, Joanna Joiner2, Alexander Vasilkov1, Pepijn Veefkind3, Johan de Haan3, Maarten Sneep3, Steve Platnick2, Galina Wind1 and Paul Menzel4 1Science Systems Applications, Inc. (SSAI) 2NASA Goddard Space Flight Center, 3Royal Netherlands Meteorological Institute (KNMI), 4University of Wisconsin Test Point OMI pixel boundary X MODIS point A 687 485 MODIS point B Sample Space boundary as defined by OMI pixel corners • MODIS AND OMI CLOUD PRESSURES • OMI and MODIS use different observational techniques to probe the vertical structure of clouds. Cloud pressures are needed for the accurate retrieval of ozone and other trace gases from satellite observations. The MODIS cloud top algorithm applies two methods to estimate cloud top pressure (CTP): • CO2 slicing technique using IR radiances associated with CO2 absorption bands (ch. 33, 34, 35, 36) • Comparison of the 11 mm thermal IR band (ch. 31) to a gridded profile of brightness temperatures. • In the case of OMI, solar backscattered radiances observed at the top of the atmosphere (TOA) penetrate deeper into the cloud resulting in a mean cloud pressure that represents the average pressure reached by backscattered photons. This cloud pressure is called the Optical Centroid Pressure (OCP). • OMI provides two estimates of OCP using: • Rotational Raman Scattering (RRS) Method • O2-O2 Absorption Method. • The RRS Method utilizes the high frequency structure of the TOA reflectance in the UV (~354 nm) due to RRS. RRS produces a filling-in of Fraunhofer lines in the TOA spectrum, wherethe magnitude of the filling-in is related to cloud pressure [Vasilkov et al., 2008]. The O2-O2 Absorption Method determines the OCP from the oxygen dimer absorption in the visible part of the solar spectrum [Sneepet al., 2008]. As can be seen in the figure to the left, the OCP depends on the vertical extent and optical thickness of the cloud and can differ markedly from the CTP. MODIS and OMI cloud pressures can therefore be used to detect multi-layer clouds, often associated with the overhanging anvils and cirrus associated with deep convective systems [Joiner et al., 2010]. • INTRODUCTION • Clouds cover about 60% of the earth’s surface at any given time and when present satellite’s field of view (FOV), complicate the retrieval of ozone, trace gases and aerosols by the earth observing satellites. Cloud properties associated with optical thickness, cloud pressure, water phase, drop size distribution (DSD), cloud fraction, vertical and areal extent can vary significantly over short spatio-temporal scales and should be taken into account in radiative transfer models used to retrieve column estimates of ozone, trace gases and aerosols. The OMI science team is currently working on a new data product (OMMYDCLD) that combines the cloud information from sensors on board two earth observing satellites in the NASA A-Train: Aura/OMI and Aqua/MODIS. The product collocates high resolution cloud and radiance fields from MODIS with the much larger OMI pixel and combines this cloud information with parameters derivedfrom the three OMI cloud products: OMCLDRR, OMCLDO2 and OMTO3. Histograms of the MODIS cloud information are provided for each OMI pixel along with the mean and standard deviation associated with each distribution. Some MODIS data fields (e.g., optical depth, effective particle radius, cloud water path and cirrus reflectivity) are further separated into ice, liquid and combined ice-liquid distributions using the optical cloud phase information from MODIS. Product applications product include: OMI calibration work, multi-year studies of cloud vertical structure, and development of otherproducts such as multi-layer cloud detection. MODIS Cloud Top Pressure Thermal IR and CO2 Cloud Slicing Photon Trapping UV/VIS OMI Optical Centroid Pressure Raman Scattering/ O2-O2 Absorption NASA A-TRAIN • INSTRUMENT CHARACTERISTICS • Instruments • Ozone Monitoring Instrument (OMI) • measures 3 solar bands • UV1: 270 to 314 nm • UV2: 306 to 380 nm • VIS: 350 to 500 nm (co-location window OMMYDCLD) • MODerate-resolution Imaging Spectroradiometer (MODIS) • 36 spectral bands ranging from 0.4 to 14.4 um • Spatial Coverage • OMI swath width:2600 km • MODIS swath width:2300 km • MODIS overlap of OMI covers rows 4 to 60 along • Field of View • OMI VIS: 13 x 24 km2 for row 30, 28 x 150 km2 for row 60 • MODIS: 1 x 1 km2 and 5 x 5 km2 (depending on the SDS) • MODIS Sampling of OMI pixel • At 1 km: ~300 for row 30, ~700 for row 60 • At 5 km: ~12 for row 30, ~ 30 for row 60 MODIS OMI MODIS Cloud Top Pressure July 2006 Aqua L1b July 20, 2006 06:15 UTZ Above Cloud Absorbing Aerosols OCP < MODIS CTP Deep Convection MODIS CTP < < OCP Aqua L1b July 04, 2006 12:50 UTZ 1600 km Aqua L1b July 4, 2006 12:50 UTZ 2000 km The OMI-MODIS cloud product co-locates the data from MODIS and OMI in space but a small temporal separation still exists between the satellites. The above schematic shows the NASA A-Train with Aqua (MODIS) leading Aura (OMI). From 2004 to 2007, the separation between the two satellites was about 15 minutes. This time difference was reduced to about 8 minutes in 2008. 800 km 1000 km METHODOLOGY OMI OCP - MODIS CTP July 2006 B A 5 25 45 65 85 Clear Liq Ice Clear Liq Ice 5 25 45 65 85 Clear Liq Ice Clear Liq Ice .05 .25 .45 .65 .85 50 150 250 350 450 .05 .25 .45 .65 .85 .05 .25 .45 .65 .85 50 150 250 350 450 .05 .25 .45 .65 .85 FIG. A: A typical OMI orbit (red) is shown with overlapping 5-min MODIS granule (blue). About 200 OMI scan lines are processed per MODIS granule. FIG. B: An OMI pixel and a corresponding Sample Space – defined along constant latitudinal and longitudinal boundaries – are constructed using OMI pixel corner product OMPIXCOR. To determine if a MODIS pixel is inside the OMI pixel – constructed by forming straight linesbetween pixel corners – a test point (X) is arbitrarily selected just outside of the Sample Space and a line is defined between the test point and the center of the MODIS pixel). Furthermore, line equations are defined for each of the four OMI pixel boundaries. A “line crossing test” is then applied to determine if the MODIS pixel falls inside of the OMI pixel boundaries. The test counts the number of intersections between ) and the OMI pixel boundaries. If the number of intersections is odd, then the MODIS pixel is inside the OMI pixel boundaries (shown in red), otherwise it is outside (shown in blue). FIG. C: Anexample of cloud top pressure for a full day of processed OMI orbits. Note that the data gaps observed between successive orbits near the equator is due to a lack of coverage associated with the missing OMI rows 1-3. g/m^2 g/m^2 MODIS Cloud Top Pressure July 15 2006 C • APPLICATIONS • Improve radiative transfer associated with the scattering and absorption properties of clouds at the scale of the OMI pixel (e.g., OMI calibration work) • Investigate scientific questions related to cloud structure, dynamics and climatology • Improve trace gas retrievals in presence of clouds • Combine multi-satellite measurements from different instruments on the NASA A-Train into a single science product REFERENCES Joiner, J., Vasilkov, A. P., Gupta, P., Bhartia, P. K., Veefkind, P., Sneep, M., de Haan, J., Polonsky, I., and Spurr, R., 2012: Fast simulators for satellite cloud optical centroid pressure retrievals; evaluation of OMI cloud retrievals, Atmos. Meas. Tech., 5, 529-545, doi:10.5194/amt-5-529-2012. Joiner, J., Vasilkov, A. P., Bhartia, P. K., Wind, G., Platnick, S. and W. P. Menzel, 2010: Detection of multi-layer and vertically-extended clouds using A-train sensors, Atmos. Meas. Tech., 3, 233-247. Sneep, M., J. F. de Haan, P. Stammes, P. Wang, C. Vanbauce, J. Joiner, A. P. Vasilkov, and P. F. Levelt, 2008: Three-way comparison between OMI and PARASOL cloud pressure products, J. Geophys. Res., 113, D15S23, doi:10.1029/2007JD008694. Platnick, S, M. D. King, S. A. Ackerman, W. P. Menzel, B. A. Riedi and R. A. Frey, 2003: The MODIS cloud products: algoritms and examples from Terra, IEEE, 41, Issue 2. pp. 459 – 473. Vasilkov, A. P., J. Joiner, R. Spurr, P. K. Bhartia, P. F. Levelt, and G. Stephens, 2008: Evaluation of the OMI cloud pressures derived from rotational Raman scattering by comparisons with satellite data and radiative transfer simulations, J. Geophys. Res., 113, D15S19, doi:10.1029/2007JD008689.