Download
1 / 19
240 likes | 945 Views
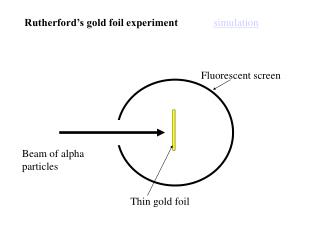
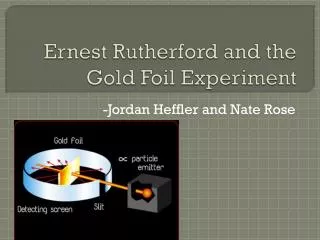
The Geiger - Marsden Experiment aka Rutherfords Gold Foil Experiment. The Geiger - Marsden Experiment aka Rutherfords Gold Foil Experiment. We get a planetary view of the atom Nucleus 1/10,000 atoms diameter 99.9% of atoms mass is in the nucleus BUT.....!!!. 1913 Niels Bohr.

E N D
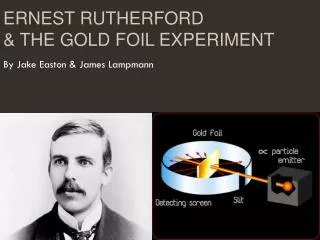
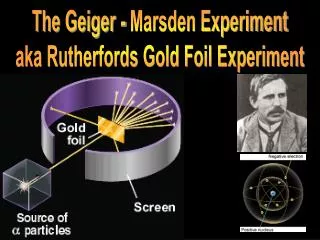
The Geiger - Marsden Experiment aka Rutherfords Gold Foil Experiment
The Geiger - Marsden Experiment aka Rutherfords Gold Foil Experiment We get a planetary view of the atom Nucleus 1/10,000 atoms diameter 99.9% of atoms mass is in the nucleus BUT.....!!!
1913 Niels Bohr • An orbiting electron must be accelerating…..WHY??? • Changing direction • So, it must radiate energy….WHY? • Accelerating charges cause EM radiation • KE & Momentum should be lost due to E-M radiation. Electron should spiral inward to nucleus
62 52 42 n=32 n=6 n=1 (Ground State) n=3 (2nd excited state) n=2 (1st excited state) n=4 n=5 Larger Jump = More Energy = Bluer Wavelength
26 25 24 n=23 n=6 n=1 (Ground State) n=3 (2nd excited state) n=2 (1st excited state) n=4 n=5 Photons of all other energies (wavelengths) are ignored and pass on by unabsorbed.
Hydrogen Helium Oxygen Neon Iron
Stellar Spectra Provide Info about Stars • Nebula NGC 2363 • This nebula is a glowing gas cloud about 10,000,000 LY from Earth. • The hot stars in the Nebula emit high energy photons that are absorbed by the gas. • The heated gases produce an emission spectrum and the particular wavelength of the red light of the nebula is 656nm. The exact wavelength of Hydrogen.
The Suns Absorption Spectrum The Suns Absorption Spectrum from 420 – 430 nm. (TOP) The emission spectrum of Iron (Bottom)
Stellar Spectral Classification • In the late 1800’s astronomers were trying to organize and make sense of all the data they were collecting. • At the time, spectra studies were the most reliable, but there is a huge diversity of stellar spectra. • In 1870’s stars were classified into various letters based upon their spectral patterns. "Oh, Be A Fine Girl, Kiss Me!"
Stellar Spectral Classification Hydrogen Balmer Lines Very Weak due to extreme temps Hydrogen Balmer Lines Strongest Hydrogen Balmer Lines fading out and trace amounts of heavier elements starting to appear Stars containing heavier metals such as Calcium and Iron (Including the Sun, a G2 star) Stars containing Titanium Oxide
Stellar Spectral Classification • In short, the OBAFGKM system allows us to • Identify the surface temperature of the stars • Chemical composition of the stars
Key Properties of Nearby Stars So we can determine the distances and characteristics of Stars We need a better classification scheme Where 4πR2 = area of a sphere