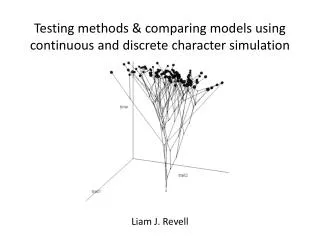
Testing methods & comparing models using continuous and discrete character simulation
Testing methods & comparing models using continuous and discrete character simulation. Liam J. Revell. Motivating example: phylogenetic error and comparative analyses. Phylogenetic comparative analyses often (but not always) assume that the tree & data are known without error.

Testing methods & comparing models using continuous and discrete character simulation
E N D
Presentation Transcript
Testing methods & comparing models using continuous and discrete character simulation Liam J. Revell
Motivating example: phylogenetic error and comparative analyses • Phylogenetic comparative analyses often (but not always) assume that the tree & data are known without error. • (An alternative assumption is that the sampling distribution obtained from repeating the analysis on a sample of trees from their Bayesian posterior distribution will give a unbiased estimate of the parameter’s sampling distribution.) • To test this, I simulated trees & data, and then mutated the trees via NNI.
Nearest neighbor interchange: Reattach Dissolve internal branches Felsenstein2004
Topological error: σ2 Simulation 2
Topological error: model selection 100 OU lambda BM 80 60 selected model (%) 40 20 0 5 15 25 35 45 55 65 75 85 95 random NNIs Simulation 1
Motivating example: phylogenetic error and comparative analyses • This result shows that topological error introduces non-random error (bias) into parameter estimation. • It also suggests that averaging a posterior sample is also biased – and perhaps from some problems a global ML or MCC estimate might be better (although I have not simulated this). • Finally, topological error can cause us to prefer more complex models of evolution.
Outline • Discrete vs. continuous time simulation: • Example 1: Brownian motion simulation. • Example 2: Discrete character evolution. • Alternative methods for quantitative character simulation. • Visualizing the results of numerical simulations: • Projecting the phylogeny into phenotype space. • Mapping discrete characters on the tree. • Uses of simulation in comparative biology. • Stochastic character mapping. • Phylogenetic Monte Carlo. • Testing comparative methods. • Conclusions.
Discrete time simulations • Note that discrete & continuous time have nothing at all to do with whether the simulated traits are discrete or continuous. • In discrete time, we simulate evolution as the result of changes additively accumulated over many individual timesteps. • Timesteps may be (but are not necessarily – depending on our purposes) organismal generations.
Example: Brownian motion • In Brownian motion, changes in a phenotypic trait are drawn from a normal distribution, centered on 0.0, with a variance proportional to the time elapsed x the rate. • In a discrete time simulation of Brownian motion, every “generation” is simulated by a draw from a random normal with variance σ2dt (or σ2ti for the ith generation).
Example: Brownian motion • We can simulate Brownian evolution for a single or multiple lineages. n<-1; t<-100; sig2<-0.1 time<-0:t X<-rbind(rep(0,n),matrix(rnorm(n*t,sd=sqrt(sig2)),t,n)) Y<-apply(X,2,cumsum) plot(time,Y[,1],ylim=c(-10,10),xlab="time",ylab="phenotype",type="l") apply(Y,2,lines,x=time) text(0.95*t,9,bquote(paste(sigma^2,"=",.(sig2))))
Example: Brownian motion • We can simulate Brownian evolution for a single or multiple lineages. n<-1; t<-100; sig2<-0.1 time<-0:t X<-rbind(rep(0,n),matrix(rnorm(n*t,sd=sqrt(sig2)),t,n)) Y<-apply(X,2,cumsum) plot(time,Y[,1],ylim=c(-10,10),xlab="time",ylab="phenotype",type="l") apply(Y,2,lines,x=time) text(0.95*t,9,bquote(paste(sigma^2,"=",.(sig2))))
Example: Brownian motion • We can simulate Brownian evolution for a single or multiple lineages. n<-100; t<-100; sig2<-0.01 time<-0:t X<-rbind(rep(0,n),matrix(rnorm(n*t,sd=sqrt(sig2)),t,n)) Y<-apply(X,2,cumsum) plot(time,Y[,1],ylim=c(-10,10),xlab="time",ylab="phenotype",type="l") apply(Y,2,lines,x=time) text(0.95*t,9,bquote(paste(sigma^2,"=",.(sig2))))
Example: Brownian motion • We can simulate Brownian evolution for a single or multiple lineages. n<-100; t<-100; sig2<-0.05 time<-0:t X<-rbind(rep(0,n),matrix(rnorm(n*t,sd=sqrt(sig2)),t,n)) Y<-apply(X,2,cumsum) plot(time,Y[,1],ylim=c(-10,10),xlab="time",ylab="phenotype",type="l") apply(Y,2,lines,x=time) text(0.95*t,9,bquote(paste(sigma^2,"=",.(sig2))))
Example: Brownian motion • We can simulate Brownian evolution for a single or multiple lineages. n<-100; t<-100; sig2<-0.1 time<-0:t X<-rbind(rep(0,n),matrix(rnorm(n*t,sd=sqrt(sig2)),t,n)) Y<-apply(X,2,cumsum) plot(time,Y[,1],ylim=c(-10,10),xlab="time",ylab="phenotype",type="l") apply(Y,2,lines,x=time) text(0.95*t,9,bquote(paste(sigma^2,"=",.(sig2))))
Example: Brownian motion • We can simulate Brownian evolution for a single or multiple lineages. • The expected variance on the outcome is just: (due to the additivity of variances) • Does this mean that if we were just interested in the end product of Brownian evolution we could simulate ? • Yes.
Example: Brownian motion • Discrete time. n<-100; t<-100; sig2<-0.1 time<-0:t X<-rbind(rep(0,n),matrix(rnorm(n*t,sd=sqrt(sig2)),t,n)) Y<-apply(X,2,cumsum) plot(time,Y[,1],ylim=c(-10,10),xlab="time",ylab="phenotype",type="l") apply(Y,2,lines,x=time) text(0.95*t,9,bquote(paste(sigma^2,"=",.(sig2))))
Example: Brownian motion • this is a continuous time simulation. • One big step . . . . n<-100; t<-100; sig2<-0.1 time<-c(0,t) X<-rbind(rep(0,n),matrix(rnorm(n,sd=sqrt(sig2*t)),1,n)) Y<-apply(X,2,cumsum) plot(time,Y[,1],ylim=c(-10,10),xlab="time",ylab="phenotype",type="l") apply(Y,2,lines,x=time) text(0.95*t,9,bquote(paste(sigma^2,"=",.(sig2))))
Example: Discrete character • We can also simulate changes in a discrete character through time as a discrete-time Markov process or Markov chain. • This is just a way of saying that the process is memoryless – i.e., its future state is only dependent on the present state of the chain, and not at all on what happened in the past. • When we simulate the evolution of a discrete character, we need a probability for change per step in the chain. • Imagine a character with initial state “blue” that changes to “yellow” (and back again) with a probability of 0.2. 8 12 t = 1 2 3 4 5 6 7 9 10 11
Example: Discrete character • We can look at the average properties of discrete time Markov chains using simulation as well: 0 20 40 60 80 100 n<-100; t<-100; p<-0.1; x<-list(); x[[1]]<-rep(0,n) for(i in 1+1:t){ x[[i]]<-x[[i-1]]; z<-runif(n)<p x[[i]][intersect(which(x[[i-1]]==0),which(z))]<-1 x[[i]][intersect(which(x[[i-1]]==1),which(z))]<-0 } y<-sapply(x,mean) barplot(rbind(y,1-y),col=c("blue","yellow"),xlab="time")
Example: Discrete character • We can look at the average properties of discrete time Markov chains using simulation as well: 0 20 40 60 80 100 n<-100; t<-100; p<-0.01; x<-list(); x[[1]]<-rep(0,n) for(i in 1+1:t){ x[[i]]<-x[[i-1]]; z<-runif(n)<p x[[i]][intersect(which(x[[i-1]]==0),which(z))]<-1 x[[i]][intersect(which(x[[i-1]]==1),which(z))]<-0 } y<-sapply(x,mean) barplot(rbind(1-y,y),col=c("blue","yellow"),xlab="time")
Example: Discrete character • For continuous time discrete character simulation, the probability distribution for x is found by matrix exponentiation of the instantaneous transition matrix Q, i.e.: • Thus, to simulate the state at time t given the state at time 0, we first compute the right product (a vector) and assign the state randomly with the probabilities given by pt. • We can do this and compare to our replicated discrete time simulations.
Example: Discrete character • Here’s our discrete time simulation, replicated 1000 times: 0 20 40 60 80 100 n<-1000; t<-100; p<-0.01; x<-list(); x[[1]]<-rep(0,n) for(i in 1+1:t){ x[[i]]<-x[[i-1]]; z<-runif(n)<p x[[i]][intersect(which(x[[i-1]]==0),which(z))]<-1 x[[i]][intersect(which(x[[i-1]]==1),which(z))]<-0 } y<-sapply(x,mean) barplot(rbind(1-y,y),col=c("blue","yellow"),xlab="time")
Example: Discrete character • Here’s our continuous time probability function, overlain: 0 20 40 60 80 100 p0<-c(1,0) Q<-matrix(c(-p,p,p,-p),2,2) time<-matrix(0:t) y<-apply(time,1,function(x,Q,p0) expm(Q*x)%*%p0,Q=Q,p0=p0) plot(time,y[1,],ylim=c(0,1),type="l")
Example: Discrete character • What about the wait times to character change? • Well, under a continuous time Markov process the waiting times are exponentially distributed with rate –qii. • We can compare our discrete time simulation wait times to the expected distribution of waiting times in a continuous time Markov.
Example: Discrete character • First, compute (first) waiting times from our simulation of earlier: wait<-vector() X<-sapply(x,rbind) for(i in 1:nrow(X)){ if(any(X[i,]==1)) wait[i]<-min(which(X[i,]==1)) else wait[i]<-t } hist(wait,main=NULL,xlab="First waiting time (generations)")->temp
Example: Discrete character • Now, compute and overlay the exponential densities: z<-vector() for(i in 2:(length(temp$breaks))) z[i-1]<-(pexp(temp$breaks[i],p)-pexp(temp$breaks[i-1],p))*n lines(temp$mids,z,type="o")
Methods for quantitative character simulation on a tree • We have discussed simulating characters along single lineages. • To simulate character data on a tree we have multiple choices. • We can draw changes along edges of the tree from the root to any tip: 0.36 +0.36 t1 0.00 -0.29 0.55 t2 0.84 +0.84 +0.33 1.17 t3
Methods for quantitative character simulation on a tree • An alternative approach utilizes the fact that shared history of related species creates covariancesbetween tip species. • If we simulated data with this covariance, then it will be as if we had simulated up the tree from root to tips. t1 t2 t3
Covariances between species? • A useful way to think about the covariance between species under BM is just the (long run) covariance of the tip values of related species from many replicates of the evolutionary process. • We can explore this concept by simulation (naturally). t1 t2 t3
Covariances between species? Covariance depends on the relative shared history of species. t1 t2 50% t3 t1 t2 X<-t(fastBM(tree,nsim=1000)) pairs(X,diag.panel=panel.hist) t3
Covariances between species? Covariance depends on the relative shared history of species. 50% t1 t2 X<-t(fastBM(tree,nsim=1000)) pairs(X,diag.panel=panel.hist) t3
Covariances between species? Covariance depends on the relative shared history of species. t1 t1 t2 t2 90% t3 t3 tree$edge.length<-c(0.9,1,0.1,0.1) X<-t(fastBM(tree,nsim=1000)) pairs(X,diag.panel=panel.hist)
Covariances between species? Covariance depends on the relative shared history of species. t1 t2 90% t3 tree$edge.length<-c(0.9,1,0.1,0.1) X<-t(fastBM(tree,nsim=1000)) pairs(X,diag.panel=panel.hist)
Covariances between species? Covariance depends on the relative shared history of species. t1 t1 t2 t2 t3 10% t3 tree$edge.length<-c(0.1,1,0.9,0.9) X<-t(fastBM(tree,nsim=1000)) pairs(X,diag.panel=panel.hist)
Covariances between species? Covariance depends on the relative shared history of species. t1 t2 10% t3 tree$edge.length<-c(0.1,1,0.9,0.9) X<-t(fastBM(tree,nsim=1000)) pairs(X,diag.panel=panel.hist)
Covariances between species? • This gives an alternative means of simulating under BM: we can just draw a vector of correlated values from the multivariate distribution expected for the tips. • In particular, for: and we simulate from: What does this look like? t1 1.0 0.1 t2 0.9 0.1 t3
Covariances between species? t1 t2 t3 X<-t(fastBM(tree,nsim=1000)) pairs(X,diag.panel=panel.hist) X<-matrix(rnorm(3000),1000,3)%*%chol(C) pairs(X,diag.panel=panel.hist)
Visualization tree<-pbtree(n=6,scale=1) tree<-read.tree(text=write.tree(tree)) X<-t(fastBM(tree,nsim=1000)) for(i in length(tree$tip)+1:tree$Nnode) tree<-rotate(tree,i) plotTree(tree,pts=F,fsize=1.5) pairs(X,diag.panel=panel.hist)
Visualization • We have many options for visualizing phenotypic evolution on the tree (simulated or reconstructed). • One method is via so-called “traitgrams,” in which we project our tree into a phenotype/time space. • We can use known or estimated ancestral phenotypic values. • Traitgrams are plotted by drawing lines between ancestors and descendants that obtain their vertical dimension from known or estimated trait values; and their horizontal dimension from the tree.
Visualization • Traitgram for one trait with known ancestral values: tree<-pbtree(n=20,scale=100) x<-fastBM(tree,internal=TRUE) phenogram(tree,x)
Visualization • Traitgram for one trait with estimated ancestral values: tree<-pbtree(n=20,scale=100) x<-fastBM(tree,internal=TRUE) phenogram(tree,x) phenogram(tree,x[1:length(tree$tip)])
3D traitgram • We can also plot a traitgram in two phenotypic dimensions, with time represented as a third dimension. tree<-pbtree(n=40,scale=100) X<-sim.corrs(tree,matrix(c(1,0.8,0.8,1),2,2)) fancyTree(tree,type="traitgram3d",X=X,control=list(box=FALSE)) movie3d(spin3d(axis=c(0,0,1),rpm=10),duration=10,dir="traitgram3d.movie",convert=FALSE)
“Phylomorphospace” • Another technique we can use to visualize multivariate evolution is by projecting the tree into 2 or 3D morphospace (defined only by the trait axes). • This has been called a “phylomorphospace” projection (Sidlauskas 2008).
“Phylomorphospace” • 2D phylomorpho-space for correlated characters. phylomorphospace(tree,X)
“Phylomorphospace” • 3D phylomorpho-space. phylomorphospace(tree,X) X<-cbind(X,fastBM(tree)) phylomorphospace3d(tree,X) movie3d(spin3d(axis=c(1,1,1),rpm=10),duration=10,dir="phylomorphospace.movie",convert=FALSE)
Discrete character evolution • We can simulate discrete character evolution too. • One way to do this is to draw wait times from their expected distribution, and then change states with probabilities given by Q. • We can not only record the outcome of this simulation, but also the character history on the tree.
Discrete character evolution • Let’s try: tree<-pbtree(n=100,scale=1) tree<-sim.history(tree,Q=matrix(c(-1,1,1,-1),2,2),anc=1) cols<-c("blue","red"); names(cols)<-c(1,2) plotSimmap(tree,cols,pts=FALSE,ftype="off")
Trait dependent evolution • Finally, we can simulate the rate or process of evolution in a continuous trait as a function of the state for a discrete character. • This works the same way as our previous Brownian motion simulations, except that in this case the instantaneous variance differs on different branches & branch segments.
Trait dependent evolution • Let’s simulate this and then visualize it using a traitgram. • First a phylogeny with an encoded discrete character history: tree<-sim.history(pbtree(n=30,scale=1),Q=matrix(c(-1,1,1,-1),2,2),anc=1) cols<-c("blue","red"); names(cols)<-c(1,2) plotSimmap(tree,cols,pts=F,ftype="i",fsize=0.75)