Download

1 / 23
240 likes | 399 Views
WDAC3, Agenda item 3. Flux analysis and modeling Data Assimilation, Uncertainties. Paul Poli Participation to WDAC3 on behalf of Jean-Noel Th é paut. WCRP Data Advisory Council 3 rd Session 6-7 May 2014 AULA MAXIMA, National University of Ireland, Galway, IRELAND. Outline.

E N D
WDAC3, Agenda item 3. Flux analysis and modelingData Assimilation, Uncertainties Paul Poli Participation to WDAC3 on behalf of Jean-Noel Thépaut WCRP Data Advisory Council 3rd Session 6-7 May 2014 AULA MAXIMA, National University of Ireland, Galway, IRELAND
Outline • Uncertainties are central to the problem of data assimilation • Uncertainties in fluxes produced: example with ERA-20C • Wave energy flux into the ocean • Downward radiation at a buoy • Snowfall over Siberia • Conclusions
Introduction to the estimation problem “Observations-only”data record Gross exaggeration towards discontinuity “outliers” Analysis(ensemble) “Model only” integration(ensemble) Gross exaggeration towards ‘lack of realism’
(explanation of the previous slide) • Data assimilation • Historically used to reduce uncertainties in a system state estimate • So that resulting state estimate would be of better quality, so as to initialize forecasts • Data assimilation is thus a particular case of estimation problem, optimally combining observationswith a model-based estimate, to produce the best so-called analysis state estimate which would subsequently yield the best forecasts • This is very different from the problem of estimating statically a series of states from observations without the help of physical model • It is complementary to other such methods that estimate a series of past states of the Earth’s fluid envelope using statistical filters • However, data assimilation carries in it the legacy of a step-wise, forward-looking reconstruction, adapted to and geared towards NWP needs
What we know… and what we don’t… Examples Deterministic verification (yes/no) Fast pace of progress This presentation Examples Ensemble verification (statistical measures) Former examples (now known): Very slow pace of progress (break-throughs) Conceptual justification (good reasons why…)
Using uncertainties in (24-h) 4DVAR data assimilation 10 members
Explicit representation of uncertainties Note: ERA-20C only uses a subset of the observing system, namely surface observations of pressure (ISPD 3.2.6) and marine winds (ICOADS 2.5.1) See animation of data coverage in terms of surface pressure (or http://www.youtube.com/watch?v=NUfdFCHoxHM ) and animation of data coverage in terms of surface marine wind (or http://youtu.be/Qsy_ZvH7Bjw)
Background errors estimated by ERA-20C ensemble [m/s] Over the course of the century, background error variances become smaller, horizontal structure functions become sharper Zonal wind 1900 1960 2000
A measure of total uncertainty: 1- to 7-day forecast scores, verified w.r.t analyses Removing all observations from the assimilation except for PS & marine U10 results in about 2 day-loss in forecast skill for Z500 D+1 ~ D+3 D+3 ~ D+5 D+5 ~ D+7 Impact of buoys/ southern ocean drifters? Such metrics, although important, don’t really give users a quantitative measure of product uncertainties which they can directly use in their application.
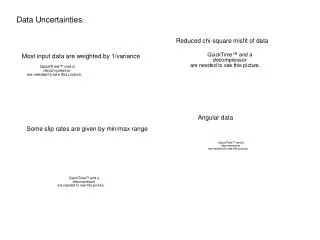
Another measure of total uncertainty, but for observations assimilated: error budget closure Showing only observations assimilated in the first 90 minutes of the 24-hour 4DVAR window Assumed Actual
Uncertainties lessons learnt from ERA-20C: a posteriori observation error estimates (Assumption for assimilation was … hPa) (1.1) (1.6) (1.5) (1.5) (0.9) (Assumption for assimilation was … m/s) (1.5) (1.5) (1.3) • Difference with assumptions (indicated in parentheses) point to need to differentiate between ships and meteorological vessels, and to recognize in some cases that the observation quality improved over time. • So future users know when and why observation quality change(d), it would be useful to regularly track quantitative improvements in the quality in global individual observations
Wave energy flux into the ocean • ERA-20C, like ECMWF NWP OPS, includes a coupled atmosphere and wave model • Wave energy flux into the ocean is a measure of wave breaking energy • Currently a sink term for the wave model • No coupling with ocean model yet – such developments are underway in the ECMWF marine section • Not incorporating wave breaking caused by bathymetry or current changes • Value: • Should lead eventually to better energy budget when coupled with ocean model (energy released by breaking contributing to turbulence in the upper ocean layers) • Locations of increased sea-atmosphere mixing? • No observations known to compare with? • See 111-second animation (@12 frames/second) • Also (hidden link) on http://www.youtube.com/watch?v=FPip4BKujmM
Mean wave energy flux into the ocean (climatology) Oceans wave break when they become unstableunder acceleration by near-surface wind, e.g. blowing away from land masses (Western sides of Atlantic and Pacific oceans, Somali jet) or intense weather (Tropical, mid-latitude storms)
(explanation of results seen in animation) • Each map (1 per month) is generated from 10 members and 3-hourly fields (total of ~10 x 8 x 30 fields per month) • Ensemble monthly mean (average over all members and within a month) shows where waves beak, on average • Intra-month variability of the ensemble mean shows locations where intra-month (3-hourly) variability is important to users keen on using data to feed non-linear downstream models. See for example signature of Tehuano wind. • Ensemble mean of the intra-month variability is larger than the previous quantity, also useful to spot locations and months which exhibit large intra-month variability • Monthly mean of the ensemble spread is a good proxy for the average 3-hourly variability. It collapses over time as more observations are assimilated. • Ensemble spread of the monthly mean shows differences between ensemble members on montlhytime-scales. It is near-zero, suggesting that the ERA-20C ensemble is lacking representation of uncertainties on monthly time-scales • Ensemble and intra-month variability is useful as a proxy for total uncertainty for users of the monthly ensemble mean. However, it only seems to represent reflect 3-hourly variability, the contribution of the 3-hourly ensemble spread is small.
Downwellingradiation at the surface • In situ direct measurements at selected sites: • WCRP BSRN, GEWEX CEOP, FLUXNET • Otherwise obtained from formulae applied to • In situ meteorological measurements • Satellite retrievals in the lower atmosphere • A few NOAA's National Data Buoy Center (NDBC) buoys are augmented by dedicated in situ radiation sensors. For example project "New England Shelf Fluxes", sponsored by JAII: Massachusetts Technology Collaborative'sJohn Adams Innovation Institute. Time-series retrieved from Woods Hole Oceanographic Institution website http://www.whoi.edu/ • “SWRAD is measured by an ASIMet SWR module employing an Eppley Precision Spectral Pyranometer (PSP)” • “LWRAD is measured by an ASIMet LWR module employing an Eppley Precision Infrared Radiometer (PIR)” • In the following, compare such observations from NDBC buoy#44008 for April – December 2010 with estimates produced by several ERA reanalyses
Longwavedownwelling radiation at buoy#44008 (hourly) Observations (in red) come from a NDBC buoy augmented by sensors funded by project "New England Shelf Fluxes“ sponsored by JAII: Massachusetts Technology Collaborative'sJohn Adams Innovation Institute. Data retrieved from Woods Hole Oceanographic Institution website on 26 April 2014
Shortwave downwelling radiation at buoy#44008 Observations (in red) come from a NDBC buoy augmented by sensors funded by project "New England Shelf Fluxes“ sponsored by JAII: Massachusetts Technology Collaborative'sJohn Adams Innovation Institute. Data retrieved from Woods Hole Oceanographic Institution website on 26 April 2014
Systematic differences: diurnal cycle average • Average all collocations by hour of the day, for April – December 2010 Hour of the day Hour of the day
Snowfall comparisons with in situ measurements E. Brun, Meteo-France
Conclusions • Known knownsimprove all the time at a fairly rapid pace • e.g. model developments seem to lead to better fluxes • Known unknowns, or the study of uncertainties, have become active areas of development with data assimilation techniques • e.g. ensemble spread, observation errors (biases also part of it) • Unknown unknowns start to become more systematically tracked down, as differences between expected and observed match to observations point to yet-to-be-understood problems • Ways forward • Observations, and their uncertainties characterizations, are paramount to progress. (e.g. difficult to find repositories of flux observations) • Would an “Annual State of the Observing System” help? • Making available systematically collocations/comparisons in observation space with state-of-the-art models and reanalyses could also help
Example: data assimilation uncertainties introduced in ERA-20C, to represent ‘known unknowns’ • Observations • Apply perturbations according to assumed observation errors • Model • Stochastic physics as in ECMWF model version CY38R1 • Forcing and boundary conditions • Sea-ice and sea-surface temperature: 10-member ensemble HadISST.2.1.0.0 (Kennedy, Rayner, Titchner, et al.) • CMIP5 recommended time evolution of solar irradiance • CMIP5 recommended time evolution of CO2 , CH4, N2O , CFC-11 and CFC-12 • AC&C/SPARC time evolution of O3 • CMIP5 recommended time evolution of tropospheric sulfate aerosols • GISS dataset time evolution of stratospheric (volcanic) aerosols • 2. to 6. above are assumed perfect – contribute no uncertainties to (re)analyses
Surface pressure observation error estimates w.r.t station altitude Station level report estimated errors seem to increase with altitude • Representativeness issues in mountains, not really observation error Sea level report estimated errors show much increased height dependence • Normal to expect that reduction to sea-level would introduces errors • Especially if the observation operator applies a pressure reduction formula different from that used by observer 4000m 3000m 2000m 1000m 0m • Pressure reduction formulae have been discussed for a while (WMO, 1954; 1964; 1968). • Last I looked into it (2013), the World Meteorological Organisation still recommended a single practice only for stations below 750 m altitude (WMO Commission for Instruments and Methods of Observation Expert Team on Standardisation, 2012). • For stations located above 750 m altitude, there still seems to be no global standard.The resulting differences reach a few hPa for high-altitude stations. 1 hPa 1.5 hPa