Download
1 / 8
80 likes | 165 Views
Dive into the difference between parameters and statistics with the Los Angeles phone survey case study. Learn to create probability simulations for better data evaluation.

E N D
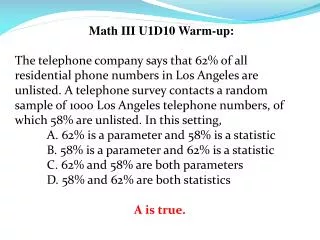
Math III U1D10 Warm-up: The telephone company says that 62% of all residential phone numbers in Los Angeles are unlisted. A telephone survey contacts a random sample of 1000 Los Angeles telephone numbers, of which 58% are unlisted. In this setting, A. 62% is a parameter and 58% is a statistic B. 58% is a parameter and 62% is a statistic C. 62% and 58% are both parameters D. 58% and 62% are both statistics A is true.
If you have not already done so, submit your Stats in the News Project
Topic: • Simulations • Objective: • Use simulations to decide if differences between parameters are significant • • Use a random number table or random number generator on a calculator for randomized selection process • • Recognize and evaluate relevant data in reports
Classwork 1: Creating Probability Simulations On the document Camera
Classwork 2: Practicing Simulations Using Graphing Technology
Homework Check : Online Test Review Questions
Unit 1 TEST TUESDAY Homework: Study for TEST