Download
1 / 183
1.83k likes | 1.86k Views
Explore the concepts of drainage basins, river processes, and flood management. Learn about types of drainage basin patterns and the impact of weather on the hydrological cycle. Enhance map-reading skills and understand the water balance in a drainage basin.

E N D
Contents Hydrological cycle and river discharge River processes Profiles and characteristics Landforms of fluvial erosion and deposition Causes and impacts of flooding Flood management strategies Exam questions
The drainage basin Lesson 1
The drainage basin and hydrological cycle (lesson 1) Lesson objectives Success criteria To recognise 4 different patterns of drainage basin. To apply knowledge to an OS map and identify 3 different drainage basins and their pattern • Students develop skills of OS map reading and identifying key river features on an OS map.
Starter: Identify the key features of the drainage basin Watershed Main river channel Source Confluence Tributary Mouth
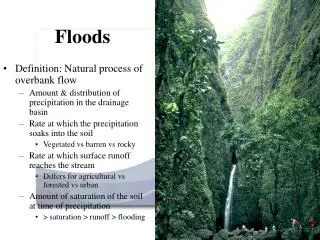
The drainage basin Drainage basin or catchment area Definition: What is a drainage basin? An area of land (also called the catchment area) drained by a river and its tributaries Task: Annotate the drainage basin to define the key word labels. The watershed mouth
Types of drainage basin The rectangular drainage pattern. Streams follow the path of least resistance and thus are concentrated in places where exposed rock is the weakest. Trellis drainagepatterns look similar to their namesake, the common garden trellis. Parallel drainage patterns form where there is a pronounced slope to the surface. Tributary streams tend to stretch out in a parallel-like fashion following the slope of the surface. A dendritic drainage pattern is the most common form and looks like the branching pattern of tree roots.
Using Ordnance Survey maps Tasks: • Using the OS map of Snowdonia, identify as three different drainage basins. 2. Having achieved this, write down the name of the main river channel that the drainage basin belongs to. • Now, identify the drainage basin pattern for each identified.
Plenary: In your books, drawn the four different drainage basin patterns that you have learnt about this lesson (without referring to your class notes!) Annotate each one identifying: • Watershed • Main river channel • Source • Confluence • Tributary • Mouth Please print the following reading from the shared area, make key notes revision cards for next lesson: Drainage basin: River Ouse
The drainage basin and hydrological cycle (lesson 1) Lesson objectives Success criteria To recognise 4 different patterns of drainage basin. To apply knowledge to an OS map and identify 3 different drainage basins and their pattern • Students develop skills of OS map reading and identifying key river features on an OS map.
Drainage basin processes Lesson 2
Drainage basin processes Lesson objectives Success criteria To be able to identify drainage basin processes. To contribute thinking of geology and the soil moisture budget. Examine how this year’s summer weather will affect the usual British Isle moisture budget. • To identify key processes of a drainage basin. • Students be able to work out and construct soil moisture budget.
Starter: Task: Write down 5 words that you would use to describe this summer’s weather. Examine the impacts of this on our drainage basins.
The drainage basin as an open system Inputs Ways in which water enters the system Ways in which water leaves the system Outputs The drainage basin forms part of the hydrological cycle, and can be described as an ‘open’ system involving a series of; Can you define these terms? Stores Ways in which water is held in the system Ways in which water is moved through and within the system Transfers
Task: Complete the handout of a typical drainage basin. In order to complete this you will need 4 different colours. Assign each shape in the key with a colour and then colour the shapes accordingly in the diagram. Now, label each shape with the correct process.
Elements of the system Name each store Name each transfer Name the Input Name each Output Transpiration Precipitation Throughfall + stemflow Interception by vegetation Infiltration Throughflow Soil water storage Evaporation The water table (position varies) Surface (overland) runoff Percolation Surface storage - lakes, rivers, sea, depression storage Groundwater (base) flow Groundwater storage Saturated or impermeable rock
The water balance This is the balance between inputs and outputs in the drainage basin. It is expressed as: P + Q +E (+/-), where; P = precipitation Q = run-off E = evapotranspiration (+/-) = change in storage The graph shows the main features of the water balance – average monthly precipitation and potential evapotranspiration levels Task: Draw this model out, ensuring that it takes half an A4 page.
Understanding the water balance graph In which month(s) is there a water surplus, and why is this? Jan, Feb, March, April, Oct, Nov, Dec, when precipitation exceeds potential evapotranspiration What is soil recharge and when does this occur? The replacement of soil moisture lost during drier periods; during autumn in the UK (Oct and Nov) Field capacity is attained after soil recharge. What exactly is field capacity? It’s the maximum amount of water soil can hold
Understanding the water balance graph Q. Why is a water deficit not shown on this graph? A. In the UK, precipitation (nearly) always exceeds evapotranspiration Q. How might water balance graphs be a) useful?, and b) difficult to construct? A. They can be useful in predicting river regimes and managing drainage basins. It is however difficult to accurately measure evapotranspiration Task: Underneath your diagram of the water balance graph, Explain what the graph shows (you must refer to each process along the course of the year) Strength and weakness of using this graph
Drainage basin processes Lesson objectives Success criteria To be able to identify drainage basin processes. To contribute thinking of geology and the soil moisture budget. Examine how this year’s summer weather will affect the usual British Isle moisture budget. • To identify key processes of a drainage basin. • Students be able to work out and construct soil moisture budget.
The Storm Hydrograph and factors affecting shape of hydrographs Lesson 3 Please bring the following reading and supporting revision cards to next lesson: River hydrographs
Lesson 3 Lesson objectives Success criteria To be able to plot precipitation and discharge using two different scales. To apply base flow, run off and flood concepts to the graph. To identify the features of flashy and subdued hydrographs and suggest reasons why a flashy hydrograph or subdued hydrograph would occur. To understand the impact of land use, time of year, slope, intensity of rain, geology, previous weather on hydrograph shape.
Discharge (cumecs) rainfall Time (hours) Discharge and the storm hydrograph Peak discharge • A hydrograph shows changes in a river’s discharge over time • A storm hydrograph shows this information following a rainfall event • Name the main features of the hydrograph ? Rising limb ? Lag time ? Falling limb ? Storm flow ? Base flow ?
Factors affecting discharge Drainage basin relief Porosity of soils underlying basin Land use What factors affect river discharge? Size and shape of drainage basin Geology:permeability of underlying rock Precipitation: intensity and duration. Antecedent rainfall. Vegetation: type and seasonal variations in cover. Deforestation Drainage density
How do these factors affect the storm hydrograph? Steep rising limb as infiltration capacity of soil exceeded Greatly increased discharge, especially if ground frozen Less steep or ‘flashy’ hydrographs Reduced lag time and steeper rising limb Faster response, so shorter lag time and steeper rising limb Slower passage to river, so longer lag time Faster passage to river, so shorter lag time and steeper rising limb Interception higher - slower response, peak discharge lower Faster response and higher peak discharge
Higher peak flow as less water is ‘stored’; more water reaches the river discharge (cumecs) and rainfall (mm) time Urbanisation and the storm hydrograph Steeper rising limb due to impermeable surfaces Shorter lag time as water quickly reaches the channel via surface runoff, through drains, sewers etc Rural Urban
Flashy and subdued hydrographs Task 1: Identify the differences between A and B. Task 2: Describe and explain the conditions under which A and B may occur
Plenary: To complete the exam question handed out to you. Answer this question on the resource.
Lesson 3 Lesson objectives Success criteria To be able to plot precipitation and discharge using two different scales. To apply base flow, run off and flood concepts to the graph. To identify the features of flashy and subdued hydrographs and suggest reasons why a flashy hydrograph or subdued hydrograph would occur. To understand the impact of land use, time of year, slope, intensity of rain, geology, previous weather on hydrograph shape.
Valley profiles Please print, read and produce revision cards for the following: River long profiles and valley cross profiles Lesson 4 and 5
Lesson 4 and 5 Lesson objectives Success criteria To know the basic long and cross valley shapes. To understand what causes irregularities (knick points) To compare and contrast general profile with example of Afon Glaslyn. • Students to be able to fit a cross profile to the long profile of a river. • To understand Long profile (thalweg) and cross valley profiles and variation.
Starter: Describe the changes to this channel from source to confluence along its long profile.
The long profile • The long profile illustrates changes in altitude from the source of a river along its entire length to the mouth • The idealised model is smoothly concave (a river will achieve this once it has achieved a balance between erosion and deposition), with a steeper gradient in the upper course becoming progressively gentler towards the mouth A How would the processes of erosion, transportation and deposition change from A, through B, and to C? Height (m) B C 60 Distance from sea (km) 0
The changing cross-profile A Height (m) B C 60 Distance from sea (km) 0 A B C Upper course Middle course Lower course
OS map skills • Locate Afon Glaslyn on the OS map of Snowdonia. • Identify: Source, mouth, flow direction, stores, valley shape and channel pattern.
Plenary • Draw the long profile of any river from the Snowdonia OS map on graph paper. You will need to ensure that your scale fits onto the graph paper!
Lesson 4 and 5 Lesson objectives Success criteria To know the basic long and cross valley shapes. To understand what causes irregularities (knick points) To compare and contrast general profile with example of Afon Glaslyn. • Students to be able to fit a cross profile to the long profile of a river. • To understand Long profile (thalweg) and cross valley profiles and variation.
The River Processes Lesson 6 and 7
Lesson 6 & 7 Lesson objectives Success criteria To know what the river processes are To examine the relationship between the river processes and river formations and landforms • To understand the significance concerning the river processes
Starter:Which of these sediments will be entrained first? Why?
River processes Put a new title in your book: River Processes Think… What key processes do you think determine the size, shape and features of a river channel? 1. FLUVIAL EROSION The break-up of rocks by the action of the river Tip 2. TRANSPORTATION The movement of eroded material As we consider these processes, remember that a river’s discharge and velocity will have an impact on rates of erosion, transportation and also upon deposition 3. DEPOSITION The laying down of material which has been transported by the river
Key question: What two types of energy will dictate the rate of erosion, transportation and deposition?
Remember... At any one time the dominant process operating within the river depends on the amount of energy available. This is governed by the velocity of the flow and the discharge within the channel. Entrainment velocity: the critical erosion velocity (velocity required to pick up and transport sediment)
River processes FLUVIAL EROSION The break-up of rocks by the action of the river TRANSPORTATION The movement of eroded material DEPOSITION The laying down of material which has been transported by the river
Attrition Abrasion / corrasion What are the main processes of fluvial erosion? Hydraulic action Corrosion / solution