Download

1 / 90
930 likes | 976 Views
Learn about water quality management for rivers, sources of pollution, pollutants, and contaminants impacting aquatic ecosystems. Discover how to protect rivers through effective waste management.

E N D
Water Quality Definitions • Contaminant - any constituent in the water deleterious to a particular end use regardless of its origin and whether it occurs in the watershed, source or in a water supply system • Pollutant - any constituent in the water source deleterious to a particular end use that is of anthropogenic origin • Pollutant = subset of contaminant Contaminants Contaminants Pollutants isis.csuhayward.edu/alss/Geography/ mlee/geog4350/4350c4f01.ppt
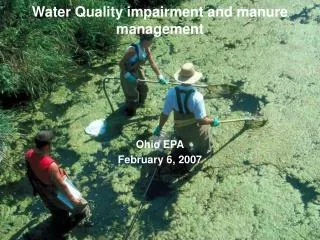
Types of Pollution • Disease-causing Agents– pathogens • Oxygen Demanding Agents– organic waste: manure • Water-soluble Inorganic Chemicals– acids, toxic metals • Inorganic Plant Nutrients– nitrogen and phosphorus • Organic Chemicals– oil, pesticides, detergents, Pharmaceuticals, MTBE • Sediment or Suspended Material– erosion, soil • Water-soluble Radioactive Isotopes– radon uranium • Heat– electric and nuclear power plants • Genetic Pollution
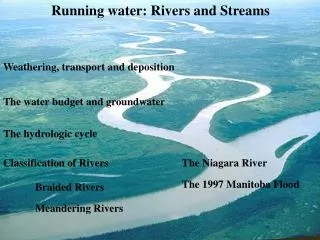
Rivers • Rivers have been easy targets for dumping of sewage and industrial wastes • Many rivers that are in industrial areas are so polluted and low in oxygen that very few species can live in them anymore
Water Quality Management • Water quality management is the science that predicts how much waste is too much for a body of water • Assimilated-amount of waste that can be tolerated by a body of water • Determined by knowing the type of pollutants discharged and their effect on water quality • Water quality is affected by natural factors: • Historical uses in the watershed • Geometry of the watershed area • Climate of the region • Good water quality protects drinking water as well as wildlife
Dissolved Oxygen DO • If the discharge of oxygen- demanding wastes is within the self-purification capacity, the DO is high • Aquatic life cannot survive without DO • Objective of water quality management is to assess the capability of a stream to absorb waste
Sources of Water Pollution • Water pollution can come from a single source • Point Source • or a variety of dispersed sources • non-point source
Point Sources of Pollutants • Point sources include domestic sewage and industrial wastes • Point sources - collected by a network of pipes or channels and conveyed to a single point of discharge in receiving water • Municipal sewage - domestic sewage and industrial wastes that are discharged into sanitary sewers - hopefully treated • Point source pollution can be controlled by waste minimization and proper wastewater treatment
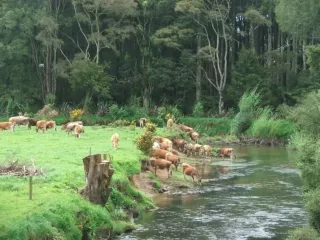
Nonpoint Sources • Urban and agricultural runoff that are characterized by overland discharge • scattered and diffuse logged forest, urban streets, lawns and parking lots • This type of pollution occurs during rainstorms and spring snowmelt • Pollution can be reduced by changing land use practices • and cannot be traced to any single site of discharge (difficult to control)
Combined Sewer Flow • Nonpoint pollution from urban storm water collects in combined sewers • Combined sewers- carry both storm water and municipal sewage
NONPOINT SOURCES Rural homes Cropland Urban streets Animal feedlot POINT SOURCES Suburban development Factory Wastewater treatment plant Point and Nonpoint Sources Fig. 22-4 p. 494
Biochemical oxygen demand • Biochemical oxygen demand (BOD)- oxidation of an organic compound is carried out by microorganisms using the organic matter as a food source • BOD is measured by finding the change in dissolved oxygen concentration before and after bacteria is added to consume organic matter
Nutrients • Nitrogen and phosphorus are considered pollutants when too much present in high conc. • High levels of nutrients cause disturbances in the food web • Organisms grow rapidly at the expense of others • Major sources of nutrients (N, P): • Phosphorus-based detergent • Fertilizer and agricultural runoff • Food-processing wastes • Animal and human waste
Toxic metals and toxic organic compounds • Agricultural runoff contains pesticides and herbicides • Urban runoff contains zinc - from tires • Too many toxic metals and toxic organic substances can leave a body of water useless • Zarjob River in Rasht • Toxic compounds can also make fish and shellfish unsafe to eat - As, Hg, Pb, and PCBs • The new concern is pharmaceutical chemicals in water and wastewater
Endocrine-Disrupting Chemicals (EDCs) • These include • Polychlorinated biphenyls • Pesticides • Phthalates • No suitable method exists to characterize EDC’s • Can mimic estrogens, androgens, or thyroid hormones • Interfere with regular animal reproduction • Affects synthesis of hormones in the body
Effect of Pollution on Streams • Pollutants can act as high-energy organic material • oxygen used at greater rate than before pollution occurred • DO level drops (dissolved oxygen sag curve) • rate of reaeration may not overcome depletion --> anaerobic • Critical DO levels occur when flow is lowest • most state regs are based on statistical low flow • UT regs based on 7-day, 10-year minimum • 7 consecutive days of lowest flow that can be expected to occur once during a 10-year interval
Effect of Pollution on Streams • Characteristics of anaerobic streams • floating sludge solids & formation of gas which bubbles to surface • gases form (ammonia and sulfide) since oxygen no longer around to act as hydrogen acceptor • some gases readily dissolved, others attach as bubbles to hunks of solid material (benthic deposits), and buoy this material to surface • H2S emitted smells like rotten eggs • color of water generally black • presence of long filamentous fungal growths which cling to rocks
Pollution of Streams Oxygen sag curve
Reservoirs and Lakes • Lakes reflect their watersheds (soils, vegetation, landuses) and climates • Morphometry (shape, depth, size) and hydrology (flushing rate) are important determinants of how lakes function • Lakes are very patchy - they are not homogeneous well-stirred bathtubs as they often appear to be - they exhibit great variability which creates large and small habitats
3 main factors determine a lake’s trophic state(its biological productivity)Watershed, climate & morphometry EVERYONE lives in a watershed! Watershed - the area of land draining to a particular lake, wetland or stream Everything that happens on the land affects its water quality • Rate of nutrient supply (from watershed & airshed) • Bedrock geology, soils, vegetation, land uses, atmospheric deposition • Climate • Sunlight, temperature, precipitation and hydrology • Morphometry • Depth (mean and max), • size (volume/area), • “roundness” (shoreline convolutions) Climate: rain, snow, wind, air temperature, flows, seasonality play a role in determining a lake’s trophic state.
Density, Thermal and Oxygen Stratification • Temperature and oxygen levels are major factors regulating aquatic organisms • The layering of lake waters due to density differences is a major factor structuring the ecosystem and creating distinct habitats • The seasonal pattern of turbulent mixing is also a critical determinant of ecosystem function and community structure
Aquatic ecosystems: Light and nutrients most limit primary production Within the photic zone the the factor that most often limits primary production is a nutrient such as nitrogen or phosphorus, or a micronutrient such as iron. Exception: upwelling regions. Fig. 54.5
O2: Human significance • Not a direct threat to humans • Directly affects fish physiology and habitat • Indirectly affects fish and other organisms via toxicants associated with anoxia: • H2S • NH4+ (converts to NH4OH and NH3 above ~pH 9) • Indirectly affects domestic water supply • H2S (taste and odor) • Solubilizes Fe (staining) • Indirectly affects reservoir turbines • Via H2S corrosion and pitting (even stainless steel) • Via regulation of P-release from sediments (mediated via Fe(OH)3 adsorption)
Two Major Sources of O2 Photosynthesis Wind energy
O2 O2 O2 Major Sinks (losses) Diffusion Water column respiration Sediment respiration (bacteria and benthos)
Phosphorus – external sources • Nonpoint sources • Watershed discharge from tributaries • Atmospheric deposition • Point sources • Wastewater • Industrial discharges Phosphorus – point sources • Wastewater • Municipal treated wastewater • Combined sewer overflows (CSOs) • Sanitary sewer overflows (SSOs) • Industrial discharges
Phosphorus – nonpoint sources • Watershed discharges from tributaries • Strongly tied to erosion (land use management) • Stormwater runoff (urban and rural) • Agricultural and feedlot runoff • On-site domestic sewage (failing septic systems) • Sanitary sewer ex-filtration (leaky sewer lines) • Atmospheric deposition • Often an issue in more pristine areas • Arises from dust, soil particles, waterfowl
Phosphorus – internal sources • Mixing from anoxic bottom waters with high phosphate levels is closely tied to iron redox reactions • O2 > 1 mg/L – Insoluble ferric (+3) salts form that precipitate and settle out, adsorbing PO4-3 • O2 < 1 mg/L (anoxic) – ferric ion reduced to soluble ferrous ion (Fe+2) – allowing sediment phosphate to diffuse up into the water • Wind mixing (storms and fall de-stratification) can re-inject high P water to the surface, causing algal blooms
Nitrogen – basic properties • Nitrogen is relatively scarce in some watersheds and therefore can be a limiting nutrient in aquatic systems • Essential nutrient (e.g., amino acids, nucleic acids, proteins, chlorophyll) • Differences from phosphorus • Not geological in origin • Unlike phosphorus, there are many oxidation states
Nitrogen – sources • Atmospheric deposition • Wet and dry deposition (NO3- and NH4+) • Combustion gases (power plants, vehicle exhaust, acid rain), dust, fertilizers • Streams and groundwater (mostly NO3-) • Sewage and feedlots (NO3- and NH4+) • Agricultural runoff (NO3- and NH4+) • Regeneration from aquatic sediments and the hypoliminion (NH4+)
Lake Productivity • Measure of a lake’s ability to support aquatic life. • Determined by determining how much algae the available nutrients will support • Increased productivity generally means reduced water quality
Management topics • Trophic status • Eutrophication • Water quality
Thousands of years New lake sediment is created over time
Definition • Eutrophic - from Greek eutophus meaning ‘high nutritious’ - where production is high and mainly based on the impact of phosphorus content of the water • Lake - a waterbody in which wind-induced turbulence plays a major role in mixing of the water column • Natural eutrophication - caused by change in form & depth of basin as it gradually fills with sediment • Cultural eutrophication - accelerated run-off from land caused by human action, e.g.., sewage, fertilizers
Trophic Status and Biotic Productivity Trophic nature of a waterbody (i.e.., soluble nutrients and resulting biotic activity) is the result of the interaction of four important factors • edaphic - refers to nutrients available to a waterbody via weathering of soils within the drainage basin. Determines if a lake is rich and productive or relatively sterile • morphologic - dimensions of the basin • climatic - range of climates from severe to favourable for growth and production • human actions - e.g.., land clearing, agriculture, damming, shoreline development
The Eutrophication Process • increased nutrients • primarily phosphorus from catchment area • > photosynthesis due to > light & > heat in summer • increased growth of primary producers • increased O2 due to photosynthesis • reduction in water transparency • due to abundance of primary producers • increased dead organic matter • increased bacteria feeding on matter • reduced oxygen contentration • reduced species populations
Indicators of trophic status • specific nutrient loading • nutrient concentration • critical phosphorus concentration : 0.01gm -3 • critical nitrogen concentration : 0.3gm -3 • hypolimnetic oxygen depletion rate: > 550mg m -3 day -1 • secchi disc depth: vanishing point < 3.0m • annual plankton primary productivity • carbon assimilation : 300 - 3000 mg m-2 day-1 • chlorophyll-a concentration : 10 - 100 mg m-3chlorophyll-a • algal densities • other trophic indicies • diatom populations : > 2 • indicator species • waterbody characteristics
Negative Biological Effects • excessive visible algal plant growth • interference with the abundance of rooted aquatic plants sensitive to light • possible interference with drinking water • hypolimnetic anoxia due to algal decomposition • reduced water transparency • rapid shift in species composition of the biological community • reduced abundance of fish associated with weed beds • fish kills • consequences for birds
Eutrophication • plentiful supply of nutrients --> uncontrolled growth of algae • when algae plus zooplankton and fish die, drop to bottom and add to carbon source for bacteria • aerobic bacteria will use all available DO to decompose this material • if deplete all available DO --> anaerobic as more bacteria produced in epilimnion, bacteria in lower portions utilize more oxygen and metalimnion --> anaerobic • all aerobic biological activity would concentrate in upper few meter • causing turbidity • decreasing light penetration • limiting algal activity to surface layers • amount of DO contributed by algae decreased • Natural aging process • Can be accelerated (cultural eutrophication) • increase in nutrients and organic substances, sediments • overstimulation in growth of algae and aquatic plants • create conditions that interfere with recreational uses of lakes, and the health and diversity of indigenous life • Problems • algae blooms which form surface mats on water • taste and odor problems due to algae • noxious plants clog shoreline and reduce access to water body • dead algae sink to bottom • fish suffocate
Stages of Eutrophication • Oligotrophic: Clear water, minimal organic matter or sediment, minimum biological activity • Mesotrophic: More nutrients, more biological activity • Eutrophic: Nutrient-rich, high biological activity, change in aquatic species • Hypereutrophic: Murky, highly productive, closest to wetland; many clearwater species cannot survive
HUMAN IMPACTS Cultural Eutrophication – Excess fertility leading to excessive plant growth 1. Increased N and P availability 2. Increased algal blooms, nutrient pulse used up 3. Algae die, increased detritus 4. Increased decomposition 5. Decreased Oxygen 6. Anaerobic conditions kill fish, other animals
Trophic (feeding metabolism) terminology Oligotrophic – low nutrients and “productivity;” usually high clarity Mesotrophic – moderate nutrients, “productivity” and clarity Eutrophic – high nutrients and “productivity;” low clarity
Classifications of Productivity Eutrophic water body Oligotrophic water body Figure 14.18b,c
Microcystis A toxic blue-green alga