Download
1 / 20
200 likes | 375 Views
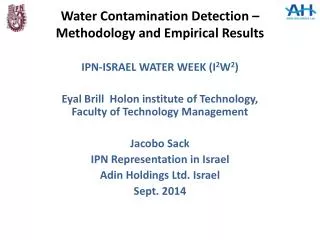
Water Contamination Detection –Methodology and Empirical Results. IPN-ISRAEL WATER WEEK (I 2 W 2 ) Eyal Brill Holon institute of Technology, Faculty of Technology Management Jacobo Sack IPN Representation in Israel Adin Holdings Ltd. Israel Sept. 2014.

E N D
Water Contamination Detection –Methodology and Empirical Results IPN-ISRAEL WATER WEEK (I2W2) Eyal Brill Holon institute of Technology, Faculty of Technology Management Jacobo Sack IPN Representation in Israel Adin Holdings Ltd. Israel Sept. 2014
Water Contamination Detection –Methodology and Empirical Results Real-time measuring of water quality is an essential necessity for the water quality manager. Few specific on line sensors developed such as: chlorine residual Turbidity pH Temperature dissolved oxygen electrical conductivity ORP and few others
Water Contamination Detection –Methodology and Empirical Results Detection of water contamination (henceforth DWC) in drinking water systems has received increasing attention over the past years that has brought to the development of: On line instrumentation real time measurements of water quality parameters Models with ability to detect water quality events (EDS: Event detection systems).
Water Contamination Detection –Methodology and Empirical Results Figure 1a: Typical weekly measurements for Conductivity and Free chlorine.
Water Contamination Detection –Methodology and Empirical Results Figure 2: Event example - Change in Figure 2 Event example. Change in Conductivity and pH
Water Contamination Detection –Methodology and Empirical Results The EPA has devoted a program called "EDS Challenge" to advance the development of EDS models has published some guidelines and conclusions about how the target of detecting contamination may be achieved.
Water Contamination Detection –Methodology and Empirical Results Identifying the occurrence of potential events in water systems, as well as in industrial systems, can be accomplished by detecting rare events. One of the most popular alternatives for implementing DWC is by using unsupervised machine learning algorithms. This methodology is similar to detecting credit card fraud transactions. In the first stage, the learning algorithm uses a "clear data" set to learn about the normal behavior of the system. (A clear data set refers to a data set where no alarms have been generated.)
Water Contamination Detection –Methodology and Empirical Results Once the knowledge about normal behavior has been established, the model has to be tested. A new data set with "cooked" events is introduced to the algorithm. The algorithm is then asked to classify each of the new records. Since the tester knows the true answers for all of the records, four possible situations may occur for each answer given by the algorithm:
Water Contamination Detection –Methodology and Empirical Results True Positive – The algorithm alerted correctly. False Positive – The algorithm alerted mistakenly. True Negative – The algorithm did not alert correctly. False Negative – The algorithm did not alert mistakenly.
Water Contamination Detection –Methodology and Empirical Results cell definition A combination of multi-dimension intervals and discrete values of the water quality variables. A record is assigned to a cell if the values of all its continuous variables are included within the boundaries of a cell, and the values of all the discrete variables are equal to the specific values of the cell. The density of a cell is the number of records assigned to each cell.
Water Contamination Detection –Methodology and Empirical Results From Dataset to Detection Model Training the model means running historical data and assigning each record to a single cell. As a result, some cells will be more populated, while others will be less populated. More populated cells are depicted as common situations, and thus, are safer. Cells with less or no records are suspect.
Water Contamination Detection –Methodology and Empirical Results When an abnormal (rare) situation occurs (for example, the intrusion of contamination into the water), the cell representing this situation is "painted" as a “bad” cell. If, in the future, a combination similar to that cell occurs, an alert will be generated. On the other hand, when a "new" situation occurs, the combination of the parameters can't be assigned to any cell. In this case, human classification (Domain Expert) is needed.
Water Contamination Detection –Methodology and Empirical Results The domain expert does the following: Correlate between measurements and events. Classify unknown situation into Good or Hazard. Evaluate models performance and initiate relearning when needed.
Table 1: Dataset properties Test data set properties
Water Contamination Detection –Methodology and Empirical Results Concluding Remarks The current paper presents a demonstrated methodology for the detection of water contamination events, based on a density table. A density table is constructed directly from the frequency of data combination occurrences. Testing the accuracy of the model is achieved by using simulating scenarios
Water Contamination Detection –Methodology and Empirical Results The methodology presented, produces a model, which enables the detection of most events, with a reasonable level of false alarms. The data base analysis made in the example that was used in our case, with data recorded over a period of six months, yielded an alarm every 4.7 days, which is on average, one alarm per week. This level of false alarms is considered reasonable in a water supply network.
Water Contamination Detection –Methodology and Empirical Results The main strengths of the methodology presented are: The ability to detect water quality events without prior engineering knowledge The method’s simplicity A relatively good detection ratio with a low rate of false alarms
Water Contamination Detection –Methodology and Empirical Results Thank you