Download
1 / 27
270 likes | 327 Views
Few replicable outcomes. Association Analysis. Spotted history Many real and presumed false positives Very difficult to know which results are ‘real’. Why so few successes in human complex trait genetics?. Obvious explanations Polygenic systems too complicated GxE interaction

E N D
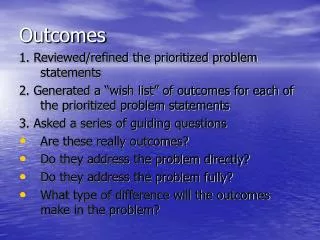
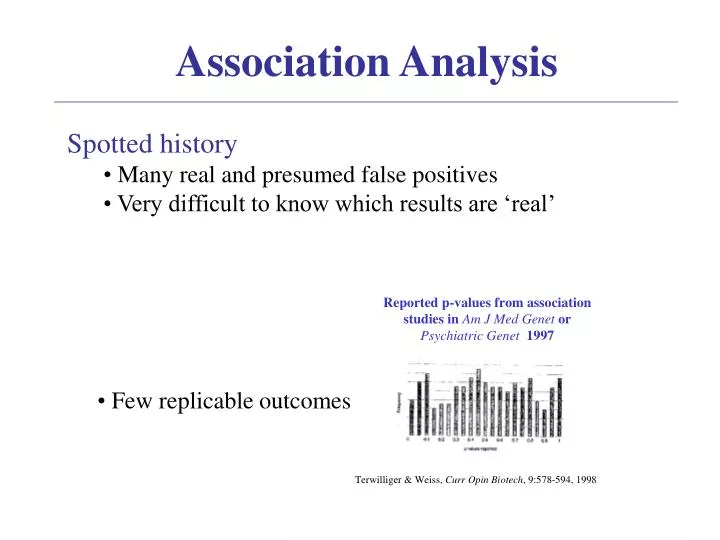
Few replicable outcomes Association Analysis • Spotted history • Many real and presumed false positives • Very difficult to know which results are ‘real’
Why so few successes in human complex trait genetics? • Obvious explanations • Polygenic systems too complicated • GxE interaction • epistasis • too many genes genes of small effect • heterogeneity • Phenotypes poorly defined/unreliable low validity • Too few markers available • Sample sizes (effect sizes) too small • Multiple testing problem unresolved • …
Genotyping Error • Genotyping accuracy one of most critical components of any • mapping study • Small amounts error cause real findings to be missed or lead to false claims of real effects • Once genotyping completed, several main ways to detect errors • 1) Look at departures from Hardy-Weinberg Equilibrium (HWE) • 2) Look for sample mixups, incorrect relationships • 3) Identify Mendelian inconsistencies in families • (also can detect excess recombinants) • Note that (1) is at marker level (‘good’ SNP, ‘bad’ SNP), (2) is at sample level; while (3) is at level of individual genotype • None of these guaranteed to detect majority of errors • Best solution is to emphasise accuracy before analysis starts…
Genotyping ErrorHardy-Weinberg Equilibrium For a SNP with two alleles, A1 and A2, and frequencies p = f(A1) and q = f(A2)…. If there is no selection, excess mutation or nonrandom mating, The genotype frequencies will be Genotype A1A1: p2 Genotype A1A2, A2A1: 2pq Genotype A2A2: q2 Genotyping error perturbs these ratios - errors often have directional bias (e.g, under-represent heterozygotes) - can have dramatic results exaggerate false-positives (esp in homozygosity mapping) lose statistical power (esp acute in complex traits) The program ‘pedstats’ tests for HWE deviations
Are Pedigree Errors Still an Issue? Excerpt from Am J Hum Genet, 2000
Pedigree Errors • Type I error increases come from, e.g.: • MZ twins coded as full-sibs, who share 2 alleles IBD at all loci • Full-siblings coded as half-sibs (expect ¼ sharing, observe ½) • Any close relative coded as more distant • Power reduction comes from: • Half-siblings coded as full-sibs • Any distant relative coded as more related than they are How many studies have unknowingly suffered (Type I or power loss) because of this?
How can this be fixed? • Different relative pairs are characterized by different patterns of allele sharing • half-sibs share more alleles on average (ibs) than full sibs • Parent-offspring pairs share the same number of alleles on average as sib pairs, but with less variability (they always share one allele) • Unrelated pairs share less than relatives
Identity by State AA x AA Aa x Aa aa x aa AA x Aa Aa x aa AA x aa 2 alleles shared ibs 1 allele shared ibs 0 alleles shared ibs With genome scan of G markers, can easily compute mean and variance of genome-wide ibs sharing for any pair of individuals i,j (the individuals need not be in the same pedigree)
Pedigree errors amongst close relatives are easy to detect in genome scans - data published in last 2 years - GRR (Abecasis et al, 2001), for other methods see McPeek & Sun (2000), Epstein et al. (2000)
Mendelian Inheritance Errors • Modest levels are likely • Up to 1% may be typical • Mendelian inheritance checks • Can detect up 30% of errors for SNPs (Gordon, Heath, Ott, Hum Hered, 1998) • Large effect on power, accuracy • Linkage vs. Association • SNPs vs. Microsatellites • Pairwise LD • Haplotype estimation (Abecasis et al, EJHG 2001; Akey et al., AJHG 2001, Kirk & Cardon, EJHG 2002)
Mendelian Error Detection 11 12 12 22
Mendelian Error Detection 11 12 22 22 11 12 ?? 22 11 12 22 Nuclear families individually consistent with Mendelian inheritance
Mendelian Error Detection 11 12 22 22 inconsistent 11 12 ?? 22 11 12 22 Consistent only if missing offspring has 22 genotype Consistent only if missing parent has 12 genotype Error detection by direct observation can miss errors
Genotyping Error: Affected Sib Pair Sample No error 0.5% error 1% error 2% error 5% error ls = 1.5; Lods calculated using Kong & Cox (signed) procedure
Genotyping Error: QuantitativeTrait Linkage Analysis 0.5% error 1% error 2% error 5% error 10% error Dense SNP map (1 SNP/2cM)
100% 90% 80% 70% 60% 50% maximum) Average LOD retained (% of 40% 30% 20% 10% 0% 0% 2% 4% 6% 8% 10% Error rate 0.050 0.100 0.200 0.300 0.400 0.5 Association Analysis Allele frequency differences
Genotype Error • Small error rates can have dramatic consequences • Effects depend on study design • ASPs lose power; DSPs inflate Type I; common allele association not great influence; rare allele worse • Crucial issue is detection • not essential that errors are resolved, just detected (LRC2003: this may turn out to be wrong!) • What levels can be tolerated in pharmacogenetics, pooling or large-scale association studies? • Detection without families hard problem Is genotype error partly responsible for marginal linkage outcomes and/or unreplicable associations?
Genotyping Error: Effects on Haplotype Estimation • Estimating haplotypes important for LD, association studies • Several different methods available to estimate haplotypes • Families (segregation) • Molecular (haploid cell lines) • Unrelated individuals (if high LD) • What effect does genotyping error have on haplotype estimation? Kirk & Cardon, Euro J Hum Genet 2002
Equifrequent alleles Unequal allele frequencies A) D) Low LD B) E) Moderate LD F) C) Haplotype Block Unrelateds Trios 4-sibs
Given methodological differences in haplotype accuracy, what is influence of error on each design?
Genotyping Error and Haplotype Estimation • At modest levels, genotyping error not great concern for family designs • Haplotype estimation in unrelateds is surprisingly robust when LD is high • But when LD low or many common alleles, serious consequences • Problem: Generally don’t know LD in advance so can’t predict outcome • Trios inefficient design • Perform slightly better than unrelateds, but too little power to detect many errors • With regard to error, trios least desirable approach • Conditional on baseline differences in haplotype estimation, individual haplotype estimation influenced about same in all designs • Genotyping error serious problem for linkage, association studies, but less so for estimation of haplotypes themselves
Simulation Study ‘Genome’ of 22 autosomes each of 100 cM (a lie) 10 markers/chromosome 5 equifrequent alleles/marker 252 unselected sib pairs >= 1 QTL somewhere in the genome background h2 moderate (30%)
Simulation Study: Exercise • FILES: F:\lon\2003\scan?.ped, scan?.dat, scan.map • Run pedstats to view HWE tests • pedstats –p scan1.ped –d scan1.ped --ignore --hardy | more • 2) Find the sample mixups using GRR. How many mixups are there? What family(ies) are involved? • Check for Mendelian errors using pedstats or merlin. Are there any? What would you do about this? • pedstats –p scan1.ped –d scan1.dat | more • merlin –p scan1.ped –d scan1.dat –m scan.map | more • What differences do you see between the programs? Can you predict the impact on the results?
Clean Data Mixed-up Data
Clean Data Genotype-error Data