Download
1 / 14
140 likes | 297 Views
Solar activity over the last 1150 years: does it correlate with climate?. S.K. Solanki 1 , I. Usoskin 2 , M. Sch üssler 1 , K. Mursula 2 1: Max-Planck-Institut für Sonnensystemforschung (previously Max-Planck-Institut für Aeronomie) 2: University of Oulu. H. Avercamp.

E N D
Solar activity over the last 1150 years: does it correlate with climate? S.K. Solanki1, I. Usoskin2, M. Schüssler1, K. Mursula2 1: Max-Planck-Institut für Sonnensystemforschung (previously Max-Planck-Institut für Aeronomie) 2: University of Oulu
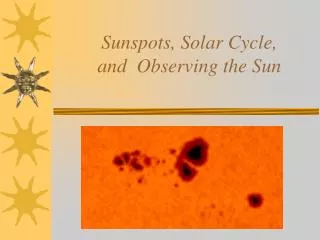
H. Avercamp Direct solar activity record Sunspot numbers provide the longest running record of directly measured solar activity
Open and closed magnetic flux Closed flux: slow solar wind A small part of the total flux through the solar surface connects as open flux to interplanetary space Open flux: fast solar wind
10Be Reconstruction of Open Flux back to 1700, based on Sunspot Number Open solar flux Interplanetary field Solanki et al. 2000 Nature
Method Sunspot numbers Model by Solanki et al. (2000) Sunspot number open magn.flux Heliospheric params Model by Usoskin et al. (2002a) Modul. strength CR intens. variations CR intensity Models of Masarik & Beer (1999) Webber & Higbie (2003) Cosmogenic isotopes Usoskin et al. (2002b) in natural archives Usoskin et al. (2004) nonlinear nonlinear
Sunspot number 850-2000 AD • Since 1610 telescopic measurement of sunspot number • Prior to that, reconstructed sunspot number from Be-10 concentrations (using simple physical model for each step) Sun is more active since ~1940 than in previous 1100 years Usoskin et al. 2003 Phys. Rev. Lett.
Comparison: Sunspot number & Climate Mann & Jones 2003 Mann, Bradley & Hughes 1999
Correlations Northern hemisphere: Correlation between SN and northern hemisphere temperatures approx. 0.5-0.55 (significance 98-99%) Trend correlates at 0.7-0.8 level (signific. 94-98%) On short term, marginal correlation, 85-95% signific. Southern hemisphere: No significant correlation for raw data and trend On short term, marginal correlation (as for N-hemisp.) Open magnetic flux and cosmic ray flux: Same correlations
Calculation of significance • Standard formulae give very high significance for correlations involving raw data (10-8 false alarm probability). • We have chosen to use the non-parametric “random phase” Monte Carlo method (following Ebisuzaki 1997) to determine the true significance. This takes into account the possibility that nearby data points are not totally independent (which appears to be the case).
Influence of Sun on climate or influence of climate on 10Be? Could the good correlation be due to climate influence on 10Be concentration? Cross-correlation shows: SN runs ahead of climate by 10 years (~1 sampling interval), which argues against climate effect on 10Be as dominant influence.
Conclusions • Sunspot numbers, open flux and cosmic ray flux reconstructed over the past 1150 years show correlations with climate in the northern hemisphere significant at 98% level. • Main effect is due to the “hockey stick” shape, which is also shown by solar data! We live not just in climatically special times, but also in times of exceptional solar activity! • Analysis excludes last 25 years, when Sun did not behave like climate (e.g. Solanki & Krivova 2003)
Outlook • Compare SN with other temperature series (in progress) and carry out multivariate regression including greenhouse gases and volcanoes etc. • Use the sunspot number record to reconstruct irradiance record via magnetic flux (in progress) • Test SN reconstruction using other cosmogenic isotopes (in progress) • Reconstruct SN further back in time: is the current period of high solar activity unique or were there also earlier such episodes? How rare are they? (in progress)