1 / 0

The Supply Chain Metrics Group

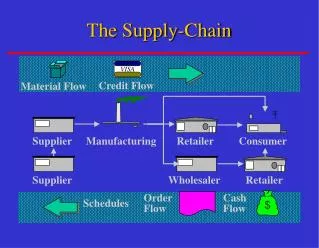
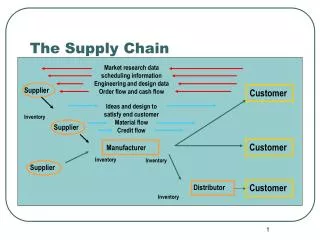
The Supply Chain Metrics Group. LMARS Support for Pipeline Measurement Performance Paul Blackwell Office of the Deputy Assistant Secretary of Defense for Supply Chain Integration March12 , 2013. Agenda. Supply Chain Metrics Group and Contributing Efforts

rafael
Download Presentation

The Supply Chain Metrics Group

An Image/Link below is provided (as is) to download presentation Download Policy: Content on the Website is provided to you AS IS for your information and personal use and may not be sold / licensed / shared on other websites without getting consent from its author. Content is provided to you AS IS for your information and personal use only. Download presentation by click this link. While downloading, if for some reason you are not able to download a presentation, the publisher may have deleted the file from their server. During download, if you can't get a presentation, the file might be deleted by the publisher.

E N D

Presentation Transcript


  1. The Supply Chain Metrics Group

    LMARS Support for Pipeline Measurement Performance Paul Blackwell Office of the Deputy Assistant Secretary of Defense for Supply Chain Integration March12, 2013
  2. Agenda Supply Chain Metrics Group and Contributing Efforts OSD Priorities for Pipeline Measurement Supply Chain Metrics Center Measurable Supply Chain Attributes “DNA” Chart for each Metric Upgrading Supply Chain Metrics Center Way Ahead Supply Chain Metrics Strategy Purpose: Integrate the metrics originating from several Department-level supply chain metrics efforts into a comprehensive set of metrics monitoring the health of the DoD supply chain. Objectives: Establish a framework of enterprise metrics for managing with measurements Develop definitions, secure data sources, and establish data collection procedures for selected metrics. Expand or enhance metrics as pipeline measurement improvements are incorporated Incorporate enterprise metrics into the OSD supply chain metrics center along with enhanced analytical and reporting capabilities.
  3. Supply Chain Metrics Group and Contributing Efforts Comprehensive Inventory Management Improvement Plan Joint Supply Chain Architecture DPO Distribution Management (Distribution Performance Reviews) Pipeline Measurement Strategic Network Optimization Business Process Improvements Supply Chain Metrics Group Ongoing Efforts
  4. OSD Priorities for Enhancement of Pipeline Measurement Addressing weaknesses identified as supply chain high risks: Unmet delivery standards and timelines for cargo shipments Incomplete delivery data for surface shipments Inadequate RFID to track cargo shipments to and within theater Lack of common operating picture for integrated distribution data Development of guidance on implementing performance management Alignment to enterprise-wide supply chain performance metrics Lack of performance measures across the enterprise Tracking of retrograde of materiel Retrograde Team Report– Sent to the Acting, USD(AT&L) on April 1, 2012
  5. Supply Chain Metrics Center Supply Chain Metrics Center Metrics to be incorporated (F) Order Response Time (N) First Pass Effectiveness (S) Retrograde Asset Write-Offs (S) Retrograde Over-Aged Due-Ins (C) Demand Forecast Error (C) Total Supply Chain Management Costs (C) Customer Price Change (C) Excess On-Order (B) Logistics Cost Baseline (LCB) (C) Supply Availability (C) NMCS Backorders (L) Logistics Response Time (LRT) (S) Repair Turnaround Time (B) Inventory Turn (D) Denial Rates (S) Retrograde Time (S) NMC Rates (S) Customer Wait Time (CWT) (L) Order Fulfillment (C) Procurement Lead Time (C) Value of Inventory (C) Excess On-Hand (DATA SOURCES) LEGEND (C) Military Services & DLA (S) Military Services (B) Working Capital Fund Budgets (L) Logistics Metrics Analysis Reporting System (LMARS) (N) Navy (F) Air Force (D) DLA CWT Tool Drill down into Service CWT records. LRT Tool Drill down into LMARS and DLA/TRANSCOM LRT records. LCB Tool Drill down into LCB records. Strat & SSIR Tools Drill down into Component inventory records Analysis Tools
  6. Metrics StructureDoD Supply Chain Metrics by Measurable Attributes
  7. “DNA” Chart for Each Metric A single information resource for all metrics related data Customer Wait TimeOrganizational Maintenance (CWTOM) Guidance & pending action Official definition for metric Computational rules Identifies data source(s) Relates metric to a supply chain attribute Reporting procedures Business value of the metric Applicable goals Proposed SC Metrics Center display Viewing options
  8. Logistics Response Time (LRT) CIMIP 7
  9. TDD Compliance
  10. Customer Wait TimeOrganizational Maintenance (CWTOM) CIMIP
  11. Inventory in PipelineOverview
  12. Metrics Center Upgrade UPGRADING CENTER A unified platform for: Enhanced metric reporting Greater spreadsheet integration Advanced and flexible data analysis Improved information displays & data visualization Streamlined user interface Simplified customization Reduced update cycle
  13. Way Ahead Update POA&M for responsiveness and reliability metrics as LMARS is enhanced with pipeline measurement improvements: Expand or complete metrics Update procedures for collecting and reporting measurements Establish or revisit goals for metrics
More Related