Download
1 / 28
540 likes | 1.13k Views
Developing An Overview of Supply Chain Performance Metrics. Process, Recommendations. McKinsey October 2003. This document gives an overview of the different metrics that can be used to measure supply chain performance.

E N D
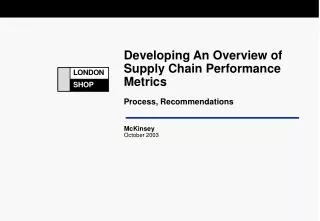
Developing An Overview of Supply Chain Performance Metrics Process, Recommendations McKinsey October 2003
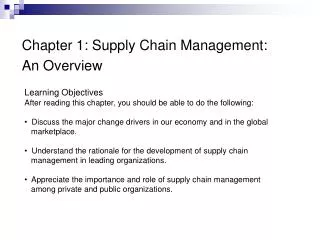
This document gives an overview of the different metrics that can be used to measure supply chain performance • The Supply Chain CoE’s objective is to define a benchmarking framework capable of: • Comparing generic metric performances for use on projects. • Capturing further benchmarking data in a consistent format. • The London Shop’s task: • Develop an overview of the different metrics to measure supply chain performance. • Select the most important metrics that can be used across industries. • Discuss how the most important metrics link other operational metrics within each stage of the supply chain. • Suggest how the supply chain CoE should continue concerning this topic.
We used information from several sources during our project • Internal and external documents: • High level benchmarking framework for supply chain performance (H .Cook): • Shop Study (March 1997) accessing information from available experts and past projects. • Supply chain benchmarks and best practice (Dow Polyurethane & Epoxy April 1995). • Supply Chain Benchmark Assessment (March 1997). • Supply chain appraisal and benchmarks: (client X September 1997). • Discussions with supply chain CoE: • Graham Colclough. • Andrew Morgan. • Lee Sherman. • Deborah Huff (Cap McKinsey).
Possible data sources • CIPS (UK): Purchasing (& Supply Chain). • APICS (US): Supply Chain. • CAPS (US): Purchasing & Supply Chain (US & Legal): • Research Benchmark Industry Listings (http://www.capsresearch//htm). • NAPM (US): Purchasing. • Kaiser Associates: Benchmark Specialist Consultant. • US University Research: New global initiative (investigating entry opportunities—Bob Ackerman).
Assigning accountability to take action when needed Linking strategy to action Accountability Focus Communication Measuring progress towards goals through interactive communication and education Performance measurement is an important but complex subject Companies see the need for metrics. . . . . . but developing the “right” set of metrics is a challenge • “If you can’t measure, you can’t manage, you can’t motivate” • Establishing the proper measures within an organisation enhances continuous • No commonly used “model”. • Business issues that warrant performance measurement: • Differ between industries. • Differ within industry. • Change overtime. There is no one “right” answer This document’s an initial step in the right direction.
Suppliers Customers We used a generic supply chain framework as a basis for our analysis . . . Supply Chain Framework Information Flow Customer Service Forecasting & Production Planning Manufacturing InboundLogistics Marketing & Sales OutboundLogistics Purchasing Maintenance Integrated Supply Chain Management Inventory Management This framework aligns with the CoE POV and is also similar to framework for the supply chain diagnostics inventory database.
Strategic objectives: Quality Information Flow Products/services according to customer expectations Forecasting & Production Planning Customer Service Manufacturing Time InboundLogistics Marketing & Sales OutboundLogistics Purchasing Maintenance On agreed time Integrated Supply Chain Management Inventory Management Cost At reasonable cost . . . and concluded there are three strategic objectives we should focus on when analysing the supply chain Supply Chain Framework • NB: Boundaries • NPDI • Support functions Tailor to company specific (BSC) objectives Key metrics must give information on how a company is performing against old strategic objectives.
We began with a brainstorming session on the key drivers for quality, time and cost Quality Time Cost Price Service Product quality Product quantity Product delivery Late arrival Late delivery Inventory cost Product cost Produc-tion cost Delivery cost Customer service cost The complete picture can be found in the appendix. • We looked at the supply chain from the customer’s perspective. • We brainstormed on “what could go wrong along the supply chain”: • What are drivers of performance from a quality, time and cost point of view.
Blind-sided Intuition Opinion Discussion Survey Functional Measures KPIs External Best Practice Qualitative Quantitative Objective 1 Objective 2 KPI KPI KPI KPI • KPI and xxx measure • “Dual service” measures (cost & time) • “Hard wired” and tennons • Push-pull Making their client specific warrants attention • Respect all sources of data: • Understand their relationships—the “causal tree”: • Recognised Cross-Industry; In-Industry and In-Company similarities and differences.
Making their client specific warrants attention (cont.) • Recognise Cross-Industry; In-Industry; and In-Company similarities and differences. • Interface the solution to the current clients’ measures, systems, processes and culture: • . . . and guide migration over time. Ensure accountability for collecting and actioning is clear.
Forecasting Purchasing Inbound Logistics Manufacturing Maintenance Inventory Management Marketing & Sales Customer Service Outbound Logistics Need to identify M&S KPIs Proposed Supply Chain KPIs Total Supply Chain Accuracy (as % of sales) % of active suppliers that account for 90% of total purchase value % of goods delivered according to order (quantity/quality) by supplier Defect rate of products as % of production % of products ordered already in stock % of customers satisfied with service % of products delivered according to customer order (quantity/quality) Customer satisfaction Quality % of satisfied customers Time from order placement to reception of goods Time from production order to delivery into finished product warehouse Total cycle time BEWARE of inter-relationships % of goods delivered on time by supplier Downtime as % of total production time Time (for customer) from placing order to receiving goods Time % of products delivered on time Cost as % of sales Cost as % of sales Cost as % of sales Cost as % of sales Total supply chain cost as % of sales Cost Cost per product sold as % of sales Number of stock turns/years KPI’s help to identify “where” the performance problem is within the supply chain, and steer towards areas to explore “why”.
Forecasting Purchasing Inbound Logistics Manufacturing Maintenance Quality Time Cost Each stage of the supply chain has a variety of metrics to monitor operational effectiveness • Actual vs. forecasted sales • % of data which can be used without modification in the planning process • % of all active suppliers that account for 90% of total purchase value • % of correct orders placed • # of alternative sources of supply • # of suppliers involved in product development/innovation • # of suppliers per purchasing employee (purchasing professional) • # of vendors products ordered • Purchasing head count as % of total head count • % of goods delivered according to order (quantify/quality) by supplier • # of carrier alliances • # of overshipments • % of direct material purchases that are not inspected at incoming quality assurance, going from stock to dock • % of direct material purchases that are not inspected at incoming quality assurance, going from stock to production • % of orders delivered without unplanned communication or special attention • Defect rate of products as % of production • Scrap rate as % of production • # of changes per production period • % of goods repackaged • Actual vs. production capacity • Nos of strategies, or “uptime” service-based contracts • Time from order placement to reception of goods • Time from production order to deliver into finished product warehouse • % of accounts payable handled before due date • % of accounts payable handed in 1–30 days • % of accounts payable handled in 31–60 days • % of accounts payable handled in 61–90 days • % of accounts payable handled in over 90 days • % of suppliers connected via EDI • Average actual time to developed/negotiate a contract • % of goods delivered on time by supplier • Proportion of suppliers who deliver daily • Proportion of suppliers who deliver frequently than monthly • Proportion of suppliers who deliver monthly • Proportion of suppliers who deliver twice weekly • Response time to schedule changes • Response time to unforeseen problems • Turnaround time on rejected items • Average production leadtime • Current manufacturing leadtime • Minimum production leadtime • Downtime as % of total production time • Downtime due to parts shortage (or stock outs in general) • Hours of unplanned downtime • Cost as % of sales • Cost as % of sales • Cost as % of total costs • Cost of orders purchased (range • Cost of vendor transactions (range) • Cost of expedite repair materials • Purchasing spend per supplier • Purchasing spend per purchasing employee (purchasing professional) • Cost as % of sales • Cost as % of total sales • Cost as % of sales • Cost per saleable unit • Cost per unit produced • Cost as % of sales • Cost per unit produced These metrics help identify “why” there is a performance problem. Source: H. Cook
Inventory Management Marketing and Sales Customer Service Outbound Logistics Total Supply Chain In addition to the KPIs each stage of the supply chain has a variety of metrics to monitor operational effectiveness (cont.) • % of products ordered already in stock • Defect rate of products as % of products leaving warehouse • Accuracy of inventory records • Inventory vs. service level • Items in inventory as % of total unit purchases • Obsolete vs. active inventory • % of correct orders taken • # of additional sales from customer referrals • # of order changes as % of orders filled • % of orders handled with commitment to product/service delivery on first call • % of customers satisfied with service • # of complaints as % of total orders • # of phone calls to customer service development per order shipped • # of complaints due to On-time delivery; Order Entry; Packaging; Product quality; Shipping Error • # of complaints as % of total orders • # of customer contacts per order • # of enquiries (including complaints) that were not answered to the customers satisfaction • # of information requests as % of customer orders • % of calls abandoned, answered by recording, delayed • % of customer contact through customer service • % of customer follow-up handled by Customer Service Representative; Department Manager; Field Representative; Responsible Manager • % of invoices containing errors • % of orders delivered complete and without error (order fill rate) • % of orders that are damaged on arrival at customer site • % of respondents that can handle complaints without handing off to other person/dept. • Average % of disputed invoices • % of products delivered according to customer order (quantity/quality) • Degree of utilisation of facilities (%) • Equipment utilisation—load • Equipment utilisation—weight • Customer satisfaction (rating) • % of satisfied customers • % of information on credit history limit available On-line • % of information on open-order history available On-line • % of information on outstanding balance available On-line • % of information on pricing available On-line • % of information on product history available On-line • % of information on product ID code available On-line • % of information on shipping points available On-line • Ratio of operations labour as % of passive labour Quality • Average # of orders rejected • Delivery time • % of products delivered early • # of deliveries per manhour • % of orders delivered on time (as defined by customer) • % of orders delivered with an average delay of 1 month • Average # of days delay after scheduled ship date • Total cycle time • Time (for customers) from placing order to receiving goods • % of products delivered on time • Average customer quoted leadtime • Average leadtime from receipt of order to shipment • Average time taken to access information • Cash to cash cycle • Longest customer quoted leadtime • New product introduction time • Product changeover time • Shortest customer quoted time • Time from receipt of order to receipt of shipment by customer • Time taken to rectify incorrect or damaged orders • Average product time in warehouse • No. of days consumption in stock (A-goods) • No. of days consumption in stock (B-goods) • No. of days consumption in stock (C-goods) • No. of days safety stock (A-goods) • No. of days safety stock (B-goods) • No. of days safety stock (C-goods) • No. of products with duplication stock • Planned days of inventory on hand • Time from order placement to start of delivery • % of accounts receivable settled before due date • % of accounts receivable settled in 1–30 days • % of accounts receivable settled in 31–60 days • % of accounts receivable settled in 91 days • % of accounts receivable settled in61–90 days • Average time taken to respond to requests Time • Cost as % of sales • # of stock turns/year • Cost as % of cost of goods purchased • Carried worth of expired lots • A-goods as a percent of inventory • Average stock level • B-goods as a percent of inventory • C-goods as a percent of inventory • Inventory cost as % of total assets (gross assets) • Maximum stock level • Minimum stock level • Cost as % of sales • Cost as % of sales • Cost as % of sales • Cost per delivery • # of route miles per delivery • # of warehousing facilities • # of warehousing of locations • % of transportation units owned by company • Cost per order • Cost per route • Total supply chain cost as % of sales • Cost per product sold as % of sales • % of profit from base purchase • % of profit from increased purchases • % of profit from premium pricing • % of revenue generated by largest customer group (top 20%) • Cost per product sold as % of sales • Operating profit per customer as % of operating costs per customer • Total cost per order • Total cost per unit produced Cost Source: H. Cook
Given the multitude of metrics we suggest to analyse supply chain performance using a hierarchy of measures Type of Measure Highest Level Use Example Objective Who Uses It • Forecasting accuracy (as % of sales) • Find “where” the problem is within the supply chain • Integrated supply chain • Generic benchmarking • Consultant • Top management • Supply chain stage manager Key KPI • % of suppliers connected via EDI • Identify the “why” within the supply chain stage • Supply chain stage diagnostic • Consultant • Supply chain stage manager Supporting Metrics • A-goods as a % of inventory • Give more in-depth information about supply chain stage • Supply chain stage diagnostic • Supply chain stage manager Other Operational Measures . . . digging through the causal tree to improve business performance.
Quality For example, the quality of customer service performance can be clearly measured at three different levels Key KPI’s Suggested Supporting Metrics Other Operational Measures • KPI’s will be measured for generic benchmarks, whilst operational metrics will be measured by a customer service manager. • . . . • % of customers satisfied with service • # of complaints as % of total orders • # of phone calls to customer service department per order shipped • # of complaints due to: order entry, packaging, shipping error, . . .) • % of calls abandoned, answered by recording, delayed, . . . • % of complaints handled by: customer service rep., department manager, . . . • # of complaints that were not answered to customer satisfaction • Average number of orders rejected
Quality Time Cost Outbound logistics performance . . . Key KPI’s Suggested Supporting Metrics Other Operational Measures • . . . • % of products delivered according to customer order (quantity/quality) • (These can often be driven by customer service metrics) • Degree of utilisation of facilities (%) • Equipment utilisation (load/weight) • Average number of days of delay after scheduled ship date • Delivery time • % of orders delivered on time (as defined by customer) • # of deliveries/man hour • % of orders delivered early • % of orders delivered with an average delay of 1 month • Cost as % of sales • Cost per delivery • Cost per order • Cost per route • # of route miles per delivery • # of warehousing facilities/locations • % of transportation units owned by company
Quality Time Cost For maintenance, commonly used supply chain performance metrics relate to time and cost Key KPI’s Suggested Supporting Metrics Other Operational Measures • The quality of maintenance is commonly measured by lag measures in terms of cost or as a production measure (downtime). • We suggest the use of two lead measures that proactively monitor maintenance performance. • . . . • Number of service contract • Number of training days for maintenance staff • Downtime as % of total production time • Downtime due to parts shortage (or stock outs in general) • Hours of unplanned downtime • Cost as % of sales • Cost per unit produced
Just remember . . . • A large number of metrics exist, so be selective. • A step by step approach to measuring supply chain performance should be undertaken in order to avoid being overwhelmed by data. • The following segmentation gives us such an approach: • 23 key KPI’s allow us to identify “where” the problems” exist within the supply chain. • Key supporting metrics then allow us to answer “why” the problems exist. • Operational metrics allow us to go analyse the supply chain stage in more detail. • The “right” set of metrics does not exist for a given industry or even a specific company. • The “right” set of metrics is dynamic like the business it measures and will change with the type of industry/problem and over time. • . . .
Next Steps for the Supply Chain CoE • Agree on how you will go forward after this project. • Agree on objectives, scope and accountabilities. • Eg. Discuss if each GMT needs its own supply chain metrics. • Further populate the supply chain benchmarking framework. • See example for Purchasing. • Championing (S. Beck/Disc. Heads). • . . . and roll-out. • Continuous improvement process.
Appendix • KPI Definitions. • Causal Trees: • Quality • Time • Cost
Benchmarking Range/Best Practice (Validate source) Average Manufacturing (Validate source) Chemicals Best Practice (Validate source) Industry Sector Global Chemical Purchasinga Automotive (Global)a Pharma. (Global)a Eng./Constr. (Global)a Measure • % of correct orders placed • # of alternative sources of supply • # of suppliers involved in product development/innovation • # of active suppliers per purchasing professional • # of vendors products ordered • % of all active suppliers that account for 90% of total purchase value • % of purchases handled by purchasing department • Purchasing head count as % of total head count • % purchases handled by purchasing function • % spend on long-term basis (>2yrs) • % firms using consortium buying • Training per purchasing professional 6–182 9–267 5–75% 0.3%–4.5% 50–87 20% 1–10% 165 7.9%(18% xxx) 82 1.4% 82% 50% 22 26 1% 97% 272 0.4% 27% 26% 42 hrs 30 21 5.5% QUALITY 2–26 weeks 65% 29% 4% 1% 1% 9 weeks 50% 42% 6% 1% 1% 11% 79% 33% 1% • % of accounts payable handled before due date • % of accounts payable handed in 1–30 days • % of accounts payable handled in 31–60 days • % of accounts payable handled in 61–90 days • % of accounts payable handled in over 90 days • % of suppliers connected via EDI • Average actual time to developed/negotiate a contract • % goods delivered on time by supplier • Time from order placement to receipt of goods TIME 0.06%–3.0% 0.30% 59% $24.8m 31/100 ¢ 18 cos £12bn 61% 26.5 15/100 ¢ !0 cos $23bn 19% 26 10/100 ¢ 19 cos $3.5bn 4 59/100 ¢ • Cost as % of sales • Cost as % of total costs • Cost of orders purchased (range • Cost of vendor transactions (range) • Cost of expedite repair materials • Purchasing spend per supplier • Purchasing spend per purchasing • Purchase Dept. expense (¢ per $ sales) COST Purchasing Data: KPIs & Benchmarks a: CAPS Research: Chemical Purchasing Benchmark 1997; H. Cook shop research.
Quality Price Service Product Quality Product Quantity Product Delivery Wrong Info. Higher Prices Than Competitors Higher Margin Than Competitors Wrong Order Information Unable to Meet Customer Demand Badly Set Customer Expectations Delivered Faulty Goods Produced Faulty Goods Products Damaged After Mfg
Time Late Arrival Late Departure Late Arrival InfrastructureFailure Product Failure Information Failure Un-controllableFactors InformationFailure InfrastructureFailure HumanFailure TechnicalFailure HumanFailure FaultyProduct Product Notin Stock WrongInformation Info. Sent to WrongPerson InformationSent Late Did Not ProduceEnough Did Not ProduceAnymore InformationSystem Failure Could Not ProduceTo Capacity Total CapacityToo Small Other ProductionPriorities Human Failure Technical Failure Did Not Have the Right Materials ForecastsIncorrect Materials Not Delivered Wrong MaterialsDelivered Materials Delivered Late SuppliersForgot We Did Not Order Suppliers GotOrder Wrong We Got Order Wrong SuppliersDelivered Late We OrderedLate InformationFailure HumanFailure TechnicalFailure
Cost Inventory Cost Purchasing Cost Production Cost Delivery Cost Customer Service Cost Too Much Stock Obsolete Stock Human Resources Costs Used More Raw Materials Used More Expensive Materials Materials Arrived Late Human Failure Technical Failure Human Resource Cost Maintenance Cost Complaints Wrong Type of Products Infrastructure Stock Wastage Planning People Systems Higher Cost Than Competitor Ordered Late Different Materials Skills Product MOT Same Suppliers Worse Deal Different Suppliers Promotion Sales Volumes Lower Don’t Know How to Negotiate Many Suppliers
Definitions for the Supply Chain KPIs • Forecasting: • Accuracy (as %of sales). • Purchasing: • % active suppliers for 90% spend. • Time from order placement to receipt. • % of goods delivered on time. • Cost as % sales. • Inbound Logistics: • % of good delivered according to order (quantity/quality) by supplier. • Time from order placement to reception of goods. • % of goods delivered on time by supplier.
Function/Process Stage Quality Time Cost Drivers and KPIs are however linked throughout the supply chain • They form a “causal tree” along the supply chain which varies between industries and over time • They do not simply drive and explain just quality, time or cost, they may drive or explain all three • We have simplified the tree in this presentation: • We have left out the links and kept the model on a generic level We have not developed a “perfect” model
These operational metrics should be used with care • Ideally they should support key KPI’s by explaining why performance is meeting/below expectations. • They should also give an in-depth picture into how well each supply chain stage is performing. • However, their use calls for judgement: • They vary across companies and industries (which explains the large quantity of metrics available). • Many are not directly linked to key KPI’s but are useful secondary indicators of performance. • They do not necessarily link to performance at just one stage in the supply chain (but accountability must be assigned to someone within one stage). • For example: inaccurate order making could lead to more time being spent on puchasing, suppliers delivering the wrong goods and/or suppliers delivering the goods late.