Sampling Distributions: The Importance of Population and Sample Characteristics
210 likes | 308 Views
Explore the significance of population and sample characteristics in understanding sampling distributions and estimating population parameters from sample statistics. Learn how to analyze probabilities and calculate outcomes with examples.

Sampling Distributions: The Importance of Population and Sample Characteristics
E N D
Presentation Transcript
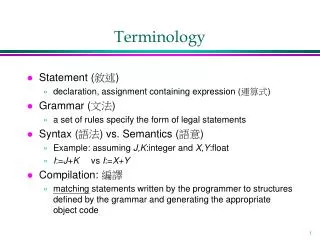
Some terminology • Population - the set of all cases about which we have some interest. • Sample - the cases we have selected from the population (randomly) • Parameter - a characteristic of the population. E.g., average age • Statistic - a characteristic of the sample
Population and Sample • Population Parameter - unknown. For example mean age of population • Sample statistic - known because we calculate it. For example the mean age of the cases in the sample. • Is the sample mean a good estimate of the population mean?
Sample represent population? • Recall example of 3 red and 7 black marbles • We took sample of size 5 (n = 5), with replacement • Our sample could contain 0, 1, 2, 3, 4, or 5 red marbles
Probability of r red marbles Sampling Distribution
What if • Sample had 0 red marbles? Surprised? No! This could happen 17% of the time with random samples from a population with 3 red and 7 black marbles. • Sample had 1 red marble? Surprised? No! This could happen 36% of the time with random samples….
What if • Sample had 2 red marbles? Surprised? No! This could happen 31% of the time with random samples from a population with 3 red and 7 black marbles. • Sample had 3 red marble? Surprised? Not really. This could happen 13% of the time with random samples….
What if • Sample had 4 red marbles? Surprised? I think so. This could happen only 3% of the time with random samples…. • Sample had 5 red marble? Surprised? Very! This could happen only .2% of the time with random samples from a population with 3 red and 7 black marbles.
Note our logic • If the population has certain characteristics • then our sample will probably include certain outcomes and probably not include other outcomes • If our sample has outcomes that are unlikely to come from that population, it probably did not come from that population
Our hypothesis is • The population has certain characteristics. • If our sample is unlikely to have come from that population, reject the hypothesis. • If our sample could easily have come from that population, fail to reject the hypothesis
The question then is • How can we tell how likely we are to get a particular result (sample with certain characteristics) from a particular population (with its characteristics)? • What are the rules for doing this? • We have already done it once with the red and black marbles. Let’s look at that again
Population characteristics • 3 red marbles • 7 black marbles • random sample with replacement • Hence p(r) = .3, p(b) = .7
Sample characteristics • Random sample with replacement of n=5 • Count number red marbles • Hence outcomes could be 0, 1, 2, 3, 4, or 5 • Find probabilities of every possible outcome
Find probabilities • All black = .7 * .7 * .7 * .7 * .7 = .17 • One red = 5 * .3 * .7 * .7 * .7 * .7 = .36 • Two red = 10 * .3 * .3 * .7 * .7 *.7 = .31 • Three red = 10 * .3 * .3 * .3 * .7 * .7 = .13 • Four red = 5 * .3 * .3 * .3 * .3 * .7 = .03 • Five red = .3 * .3 * .3 * .3 * .3 = .002 • Total = .17+.36+.31+.13+.03+.002= 1.00
Probability of r red marbles Unlikely
Try a new one • Population has 10 persons with ages 20, 20, 30, 30, 40, 40, 50, 50, 60, and 60 years (uniform population) • Mean age of population is 40 years • Random sample of n=3 (with replacement) • What outcomes might we expect?
All possible sample outcomes • 20, 20, 20: m = 20 : p= 1/5*1/5*1/5 • 20, 20, 30: m = 23.33: p= 3*1/5*1/5*1/5 • 20, 20, 40: m = 26.67: p= 3*1/5*1/5*1/5 • 20, 30, 30: m = 26.67: p= 3*1/5*1/5*1/5 • Etc. • 60, 60, 60: m = 60: p = 1/5*1/5*1/5
Group according to means • 20, 23.33, 26.67, 30, 33.33, 36.67, … , 56.67, 60 • Examine probability of each possible mean • A lot of work, and luckily we do not have to do that each time -- indeed, we could not, because we do not know all the values in the population
We assume population shape • The age distribution was a rectangular probability distribution (all ages were equally likely). • Let’s see what happens when we draw random samples of size n=3 and calculate the mean
Output of program samp sam.mean obs1 obs2 ob3 mean 1 46.66667 40 50 50 46.6 2 30 30 40 20 38.3 3 46.66667 60 40 40 41.1 4 36.66667 60 20 30 40 5 46.66667 30 60 50 41.3 6 30 30 20 40 39.4 7 50 40 50 60 40.9 8 26.66667 30 30 20 39.1 9 43.33333 40 60 30 39.6 10 36.66667 40 50 20 39.3 11 40 40 20 60 39.3 12 43.33333 20 60 50 39.7 13 36.66667 20 50 40 39.4
Results Sampling Distribution