Partial Correlation Practice: Leadership, Narcissism, Maternal Sensitivity, Social Development
Practice conducting & interpreting partial correlations among personality variables. Analyze real data sets on leadership, narcissism, maternal sensitivity, social competence, alcohol consumption, and sexual partners. Includes questions on controlling for confounding variables.

Partial Correlation Practice: Leadership, Narcissism, Maternal Sensitivity, Social Development
E N D
Presentation Transcript
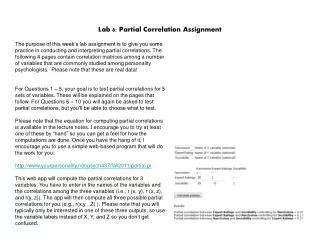
Lab 8: Partial Correlation Assignment The purpose of this week’s lab assignment is to give you some practice in conducting and interpreting partial correlations. The following 4 pages contain correlation matrices among a number of variables that are commonly studied among personality psychologists. Please note that these are real data! For Questions 1 – 5, your goal is to test partial correlations for 5 sets of variables. These will be explained on the pages that follow. For Questions 6 – 10 you will again be asked to test partial correlations, but you’ll be able to choose what to test. Please note that the equation for computing partial correlations is available in the lecture notes. I encourage you to try at least one of these by “hand” so you can get a feel for how the computations are done. Once you have the hang of it, I encourage you to use a simple web-based program that will do the work for you: http://www.yourpersonality.net/psych437/fall2011/partial.pl This web app will compute the partial correlations for 3 variables. You have to enter in the names of the variables and the correlations among the three variables (i.e., r (x, y), r (x, z), and r(y, z)). The app will then compute all three possible partial correlations for you (e.g., r(x,y . Z) ). Please note that you will typically only be interested in one of these three outputs, so use the variable labels instead of X, Y, and Z so you don’t get confused.
Data set 1: Leadership and Narcissism in Groups The following correlations come from a study on narcissism and leadership. Specifically, the authors were interested in the question of whether highly narcissistic people are more likely to emerge as leaders in groups. One of the key correlations they report is that narcissism correlates .20 with group ratings of one another’s expertise. In other words, group members attributed more expertise to highly narcissistic individuals. One potential confound, however, is that highly narcissistic people might be more outspoken or sociable in groups (as measured with the Sociability variable in the correlation table). And, in turn, outspoken people might be judged as having more expertise. Question 1. What is the partial correlation between Narcissism and Expert Ratings when statistically controlling Sociability? (bottom table) Question 2. What is the partial correlation between Narcissism and Desire to Lead after controlling for Extraversion? (top table)
Data set 2: Early Maternal Sensitivity Subsequent Social Development The following correlations come from a longitudinal study on social and emotional development. Approximately 1000 children were assessed from early childhood through Grade 6. During the first 5 years of life, Early maternal sensitivity was assessed (early sensitivity), along with the sex of the child, the family’s SES (income-to-needs), the child’s ethnicity (ethnicity, coded here in a binary fashion), and the mother’s educational levels (maternal education). At each assessment wave, Maternal Sensitivity and Social Competence (as rated by teachers) were assessed. One of the key correlations the researchers report is that Early Sensitivity correlates .28 with Social Competence at Grade 6. In other words, children who received higher levels of maternal support in the first five years of life were rated as more socially competent by their teachers at Grade 6. One potential confound, however, is that maternal sensitivity is relatively stable over time. Thus, the correlation between Early Sensitivity and Social Competence (Grade 6) might disappear if Sensitivity at Grade 5 is statistically controlled. Question 3. What is the partial correlation between Early Sensitivity and Social Competence (Grade 6) when statistically controlling Maternal Sensitivity (Grade 5)?
Fraley, R.C., Roisman, G.I., & Haltigan, J.D. (2011). The legacy of early experiences in development: Formalizing alternative models of how early experiences are carried forward over time. Developmental Psychology. G1 – G6 = grades 1 – 6. Social comp = social competence rated by teachers, income-to-needs is a measure of SES. Early sensitivity is a measure of observer ratings of maternal sensitivity toward the child during the first 5 years of life.
Data set 3: Alcohol consumption and sexual partners The following correlations come from a longitudinal study on alcohol consumption and risky sexual activity. The researchers assessed alcohol use from Age 15 to Age 28. They also assessed the number of sexual partners the subjects reported across the same assessment waves. One of the key correlations the researchers report is that the amount of alcohol that people consume correlates with the number of sexual partners they have. For example, the correlation between alcohol consumption and sexual partners is .47 at Age 15. (It is noteworthy that the correlation appears each assessment wave too.) One potential confound, however, is Impulsivity. Namely, highly impulsive adolescents might be more likely to consume alcohol and to engage in sexual behavior. Indeed, as can be seen in the table, both of these correlations are positive. Question 4. What is the partial correlation between Alcohol Consumption and Sexual Partners at Age 15 when statistically controlling Impulsivity? Question 5. What is the partial correlation between Alcohol Consumption at Age 15 and Sexual Partners at Age 21 when statistically controlling Impulsivity?
Dogan SJ, Stockdale GD, Widaman KF, Conger RD. (2010). Developmental relations and patterns of change between alcohol use and number of sexual partners from adolescence through adulthood. Developmental Psychology, 46, 1747-59.
Assignment • Turn in your answers for the first five questions. Also answer the following 5 questions. • Questions 6 – 10 • For the last 5 questions I would like for you to examine 5 other correlations that seem interesting to you among these datasets. • In each case, identify two variables that are correlated that you think are interesting. Then, think of a potential confound variable that might explain the correlation between those two variables that also exists in the same dataset. Conduct a partial correlation analysis to see what the correlation is between the original two variables when the third variable is statistically controlled. Finally, comment on what your findings suggest about the relationship between the original two variables. • For each set, be sure to list the following information: • What is the original correlation between X and Y? What does it mean “in words”? (e.g., Narcissists are more likely to be judged as having expertise in groups. r = .40) • What is a potential confound and why? (e.g., Sociability. Highly sociable people might be more narcissistic and might be more likely to be judged by others as having expertise.) • What is the partial correlation between X and Y while controlling Z. What does it mean? (e.g., The partial correlation between narcissism and expertise is .00 when holding sociability constant. This seems to suggest that the original correlation was due to the confounding influence of sociability.