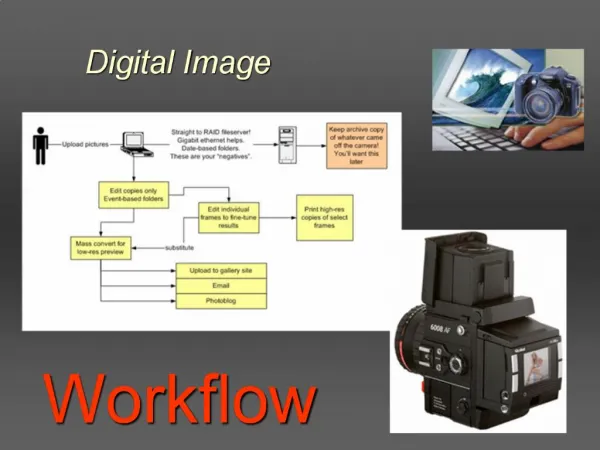
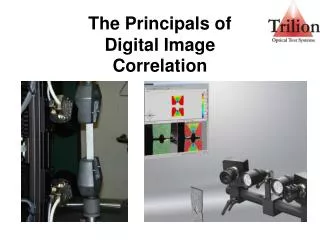
Digital Image Correlation
Digital Image Correlation. Janice Mochizuki University of Illinois, Urbana-Champaign CEE 498 Professor Dan Kuchma. Contents. Commercially available: Examples of Hardware/Software Do It Yourself: Finite Element Formulation Matlab Formulation. Correlated Solutions.

Digital Image Correlation
E N D
Presentation Transcript
Digital Image Correlation Janice Mochizuki University of Illinois, Urbana-Champaign CEE 498 Professor Dan Kuchma
Contents • Commercially available: • Examples of Hardware/Software • Do It Yourself: • Finite Element Formulation • Matlab Formulation
Correlated Solutions • Company started in 1988 to commercialize DIC invented at the University of South Carolina • Uses white speckle correlation • Instruments can process real-time data at >50 Hz • Synchronizes with load data acquisition • Strain accuracy from 500 microstrain to 500% strain • Can use on specimens from 1mm=10 meters
Vic-2D • Measures in-plane displacements and Lagrangian strain tensor • No calibration needed • No lasers required • Available for analog output • Current applications: • fracture mechanics • bi-axial tension tests • determination of strain location around cracks • FE model verification
Vic-3D • Measures actual object movement and Lagrangian strain tensor at every point • Calibration needed for strain measurements • Add on modules available • Current applications: • fuselage panel testing • car crash testing • sheet metal forming • deformation measurement of tires at high speeds
Vic-3D Vibration Analysis • Uses Videostroboscope add-on module • Measures all 3 displacement axes • Only added mass is from the speckle spray
Vic-3D High Speed • Uses multi-channel ultra-high speed cameras • Acquires at 1000 to 100,000 frames/sec • Implements rotating mirrors, photo-multipliers, and fiber-optics • Requires calibration due to distortion • uses “distortion correction technology” • Example graphics: impact on plexiglass panel Shear Strain during impact Deformation after impact
Costs Strain Overlay (Vic-3D) • Software only Vic-2D = $12, 000 • Complete Vic-2D system (software, cameras, tripod, lights) = $18,000-$22,000 • Complete Vic-3D system (includes set-up and training) = $50,000-$70,000 • Vibration add-on= additional $5,500 • High Speed Camera = additional $30,000-$200,000
Dantec Dynamics • Q-400 (3D) • Specimens up to 400x300mm2 typical (claim to make special order for larger specimens) • Measures up to 100% strain and displacements 1/10- 1/100 of a pixel • Optional high speed camera for 500-10,000 frames/sec • More user input, needs calibration • Applications: • Material testing, fracture mechanics, dynamic measurements • $75,000-$95,000 (includes illumination, cameras, and software) Mapping of 3D displacement vector
Dantec Dynamics • Q-450-II • High Speed Image Correlation for Vibration Analysis • More memory for camera=more time or fps recorded • 2 seconds at 1000 fps with 4GB • $105,000-$135,000 (no illumination) • Additional costs for illumination: • $4,000 for regular light source • $40,000-$50,000 for pulsed laser Membrane displacement graphic Out-of-plane deformation due to shock excitation
Finite Element Formulation • Used to compute 2-D displacement field • Traditional Subset-based Image Correlation Method: (comparison) • Measures full-field displacements with subpixel accuracy from pictures by matching undeformed with deformed pictures • Uses least-squares algorithm to match the pictures Undeformed Deformed
Finite Element Formulation • Element Based ICM • Discretizes image into segments and elements linked by nodes • Acquires nodal displacements by minimizing Least Square correlation coefficient between all the elements in undeformed and deformed • Displacements at a point in an element are functions of displacements of element nodes • Uses Q4 elements • Note: at the boundaries of test area, nodal displacements are higher since lack of adjoining elements to impose continuity constraints Deformed Undeformed
Finite Element Formulation • Pros of FE: • FE satisfies requirements of displacement continuity and derivative continuity among elements • FE produces smaller, more accurate strain • Cons of FE: • Subset-based method produces smaller variations in displacement data
Matlab Formulation • Code created by students at John Hopkins University in Kevin J. Hemker’s group • Created for others to build off of as an alternative to expensive commercial hardware/software • Available online at: http://www.mathworks.com/matlabcentral/files/12413/content/Correlation_Guide_2.htm
Matlab Formulation • Pre-processing: • Save all photographs as .tif 8 bit greyscale format and number consecutively • Chose all pictures to compare in pop-up window • On base picture (undeformed) define a grid for the markers • Chose bounds of area to analyze • Tell program how many pixels you want between markers in x- and y-directions
Matlab Formulation • Correlation: • Program runs through all images and markers • Initial picture has green markers • Plots red markers on second picture where displacement occurs • Then continues with all pictures in the same manner tracking the markers as it goes • Running the correlation takes about 200 seconds for 100 images with 200 markers
Matlab Formulation • Post-Processing: • Must be knowledgeable about displacement fields and strains • Delete markers with bad results • Bad lighting • Physical movement out of ordinary • Not enough data found • Option to save .jpg of each picture step to make a movie!
Matlab Formulation Example of 3D output graph Example output interface
Sources • Dantec Dynamics: sales representative & http://www.dantecdynamics.com/Default.aspx?ID=24 • Correlated Solutions: sales representative & http://www.correlatedsolutions.com/index.php • Matlab: http://www.mathworks.com/matlabcentral/files/12413/content/Correlation_Guide_2.htm • Applied Optics: (Finite Element) http://ao.osa.org/DirectPDFAccess/8A9358ED-BDB9-137E-C444F5205BBAB4B1_86402.pdf?da=1&id=86402&seq=0&CFID=22809832&CFTOKEN=13034717
Questions? Have a fun Spring Break!