Download
1 / 29
290 likes | 308 Views
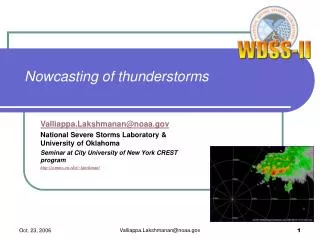
This workshop discusses the verification of nowcasting products, including the characteristics of nowcasts, challenges in verification, incorporation of uncertainty information, and new spatial verification approaches.

E N D
Verification of nowcasting products: Issues and methods Barbara Brown NCAR, Boulder, CO USA bgb@ucar.edu Collaborators: E. Ebert, E. Gilleland, R. Roberts, E. Tollerud, T. Jensen Thanks to: D. Ahijevych, J. Pinto, H. Caio, P. Nurmi 26 October 2011, Workshop on Use of NWP for Nowcasting
Topics • What makes nowcasts special • Verification Issues • Methods – old, new, and twists... • Summary and concluding thoughts
Characteristics of nowcasts High frequency and resolution ÞLarge variability in space and time SNOW-V10: Visibility forecasts and obs before mens giant snowboard slalom finals Forecasts and obs – Beijing Olympics
Characteristics of nowcasts (cont) Extreme weather • Typical focus on high-impact weather – heavy precip, strong wind, low visibility, high reflectivity, etc. • “Extreme” weather often implies “Rare” or infrequent event • Infrequent events (low “base rate”) often require special statistical treatment... Gare Montparnasse, 1895
Characteristics of nowcasts (cont) Large impact on users • Goal: Nowcasts impact users’ decision making • In designing verification it is important to • “Know” the user and the decisions being made • Identify relevant “events” to evaluate • Ask relevant questions - to provide meaningful information about forecast quality Example: SNOW-V10 May not need to get every visibility forecast correct May be more important to know whether the visibility will be below a relevant threshold sometime during an event
Issues and challenges... • Inconsistent reporting of scores Ex: What smoothing was used? Should always be reported... (NOTE: Same smoothing should be used for ALL scores; not the smoother of choice for each score) • Are scores meaningful to a user? Ex: What does CSI = 0.2 really mean? Use of more diagnostic measures helps with this... • Relationships and dependencies among scores • Determining if apparent differences are meaningful • Benefits of high resolution are also detriments for forecast evaluation Ex: High resolution, spatial and temporal variability
Ex: Relationships among scores • CSI is a nonlinear function of POD and FAR • CSI depends on base rate (event frequency) and Bias CSI Very different combinations of FAR and POD lead to the same CSI value What about the user? FAR POD
Incorporation of uncertainty information • Uncertainty information is critical aspect of forecast evaluation • Verification statistics have inherent uncertainty (sample, observations, grid) GSS GSS
Impacts of high resolution and spatial variability • Traditional approaches ignore spatial structure in many (most?) forecasts • Spatial correlations • Small errors lead to poor scores (squared errors… smooth forecasts are rewarded) • Methods for evaluation are not diagnostic • Same issues exist for ensemble and probability forecasts Grid-to-grid results: POD = 0.40 FAR = 0.56 CSI = 0.27 Forecast Observed
Which rain forecast is best? Mesoscale model (5 km) 21 Mar 2004 Global model (100 km) 21 Mar 2004 Observed 24h rain Sydney Sydney Challenge: High resolution forecasts RMS=13.0 RMS=4.6 “Smooth” forecasts generally “Win” according to traditional verification approaches. From E. Ebert
1 2 4 3 Example: Probability forecasts Example 2 Example 1 Example 5 Example 3 Example 4
Large displacement Conclusion: Calibration and skill are highly dependent on displacement
A little about methods and displays • Traditional approaches • Spatial methods • Translation to user variables • Some new measures Ensemble Workshop
Beijing Olympics 2008 • Real-time system was found to be very useful • Forecasters preferred scatterplots and Quantile-Quantile plots • These plots can also be very useful for forecast diagnostics
Timing of Modeled Storm Initiation overnight storms 1200 0800 • Model performs well during day. • Performance not a function of cycle time. • Issues with timing of overnight storms. 0400 HRRR late Model Initiation Times (UTC) 0000 2000 HRRR early 1600 1200 1200160020000000040008001200 Observed Initiation Times (UTC) *145 MCS initiation events From J. Pinto
Performance diagrams Equal lines of CSI Equal lines of Bias Success ratio = 1 - FAR From Roberts et al. 2011
New Spatial Verification Approaches Web site: http://www.ral.ucar.edu/projects/icp/ Neighborhood Successive smoothing of forecasts/obs Object- and feature-based Evaluate attributes of identifiable features Scale separation Measure scale-dependent error Field deformation Measure distortion and displacement (phase error) for whole field
HWT Example: Attribute Diagnostics for NWP Neighborhood & Object-based Methods - REFC > 30 dBZ FSS = 0.30 FSS = 0.64 FSS = 0.14 Neighborhood Methods provide a sense of how model performs at different scales (Fraction Skill Score) Object-Based Methods Provide a sense of how forecast attributes compare with observed Includes a measure of overall matching skill, based on user-selected attributes 20-h 22-h 24-h Matched Interest: 0.96 Area Ratio: 0.53 Centroid Distance: 92km P90 Intensity Ratio: 1.04 • Matched Interest: 0 • Area Ratio: n/a • Centroid Distance: n/a • P90 Intensity Ratio: n/a Matched Interest: 0.89 Area Ratio: 0.18 Centroid Distance: 112km P90 Intensity Ratio: 1.08
MODE application to HWT ensembles CAPS PM Mean Observed Radar Echo Tops (RETOP) RETOP
MODE Storm Size Distribution (Midwest) 4 hr Forecast 8 hr Forecast 12 hr Forecast Obs 2011 HRRR Log10(Number) Forecast Log10(Number) Log10(Number) Log10(Number) 2010 HRRR Log10(Number) Log10(Number) From H. Cai
Evaluation of temporal characteristics Wind change events MODE-TD: MODE with time dimension Rife et al. 2005
Translation to user-variable: Aviation capacity User translation provides info that is closer to user decision making. Evaluation faces issues similar to those for weather variables. Observed capacity Forecast capacity CSI for E-W routes 20 kft 30 kft Brier score contribution 40 kft From D. Ahijevych
New scores to consider... • SEEPS: Stable Equitable Error in Probability Space • New ECMWF ”Supplementary Headline” score for non-probabilistic forecasts of accumulated precipitation • Rodwell et al, 2010 (QJRMS, 136) • Derived from ”LEPS” (Linear Error in Probability Space) • SEDS and variants: Symmetric Extreme Dependency Score
Extreme dependency scores Standard scores tend to zero for rare events SEDI has desirable statistical properties Ferro & Stephenson, 2010: Improved verification measures for deterministic forecasts of rare, binary events. Wea. and Forecasting Base rate independence Functions of H and F Extremal Dependency Index - EDI Symmetric Extremal Dependency Index - SEDI From Nurmi 2011
Experimentation done at FMI, HMI, KNMI, M-F ... • More work is needed to assess their potential as scores for severe weather events From Nurmi 2011
Concluding thoughts • Clear disclosure of methodologies (e.g., smoothing parameters) is necessary and should be a requirement of our science • In the same vein... uncertainty estimates are critical when making comparisons, to justify decisions • CSI alone can be very misleading • Does not tell anyone much about what is really going on – especially when applied broadly to all forecasts and full domain • Caution: You can get apparently good scores for the wrong reasons • A challenge: Think beyond CSI/ETS (and FSS)
Supplementary headline measure (i): 1 - SEEPS Supplementary headline measure (i):1 – SEEPS for 24-hr deterministic Precipitation 1 – SEEPS remains above 45% Proposal Supplementary headline score for deterministic precipitation forecasts. The curve shows the number of days for which the centered 12-month mean skill remains above a specified threshold for precipitation forecasts over the extra-tropics. The verification is for 24-hour total precipitation verifying against available synoptic observations. The forecast day on the y-axis is the end of the 24-hour period over which the precipitation is accumulated. The threshold is chosen to reflect the forecast skill that is achieved at approximately day 3.5 at the beginning of the strategy period.
Supplementary headline measure (i): 1 - SEEPS • SEEPS Stable Equitable Error in Probability Space • Rodwell et al, 2010: QJRMS, 136 + Latest ECMWF Newsletter # 128 • Derived from LEPS score Linear Error in Probability Space • Forecast error is measured in probability space using the climatological cumulative distribution function • At each observation location, precipitation is partitioned into 3 categories: (i) “dry” (ii) “light precip” (iii) “heavy precip” • Long-term climatological precipitation categories at given SYNOP stations are derived Accounts for climate differences between stations • Evaluates forecast performance across all 3 categories • Stable to sample variations and obs error Good for detecting trends • Negatively oriented error measure Perfect score = 0 1 - SEEPS