Download
1 / 43
490 likes | 775 Views
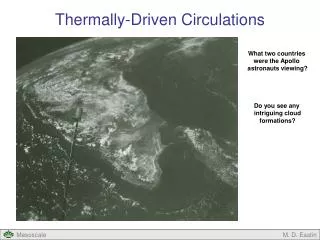
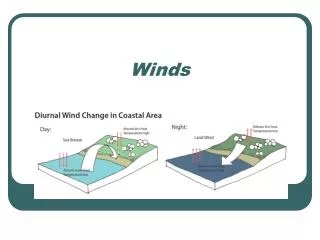
Thermally-Driven Winds Found in Mountains. Whiteman(2000). Valley Winds. Cross-section of a Mountain Valley. Whiteman(2000). Observations. Up-Valley and Down-Valley Surface Winds (Measured in Yosemite National Park). Date and Time. Valley Winds. Daytime:

E N D
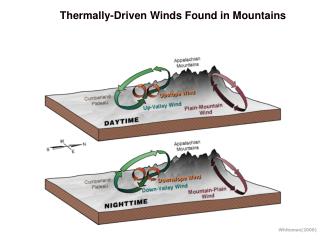
Thermally-Driven Winds Found in Mountains Whiteman(2000)
Cross-section of a Mountain Valley Whiteman(2000)
Observations Up-Valley and Down-Valley Surface Winds (Measured in Yosemite National Park) Date and Time
Valley Winds Daytime: Air is warmer in the valley than over the plain Pressure is lower in the valley and higher over the plain at the same elevation The pressure gradient force is directed from the plain to the valley A up-valley wind is produced that blows from the plain into the valley. Nighttime: Pressure gradient force reverses direction A down-valley wind occurs Up-Valley Winds Down-Valley Winds Whiteman(2000)
Valley Exit Jets Whiteman(2000)
Valley Exit Jets Whiteman(2000)
Observations Time-Height SODAR Wind Profiles 12 August 2003
‘Nose’ of Down-valley wind Vertical Structure of Down-Valley Winds Yosemite National Park, 12 Aug. 2003 Wind minimum Nose is location of Wind speed maximum
Valley wind strength frequency (Whiteman 1990)
Equations for the Valley Wind System Whiteman(1990)
The Volume Effect of Valleys Whiteman(2000)
Examples of Valley Shapes Whiteman(2000)
Draining vs. Pooling Width to cross sectional area for draining and pooling valley. Draining valleys: W/A decreases with down-valley distance. Ratio increases in pooling valleys. (Whiteman 1990)
Mass Flux in Valley Wind (Yosemite 1998) Where h is the valley depth, is air density at height, a is the valley width, and u is the up-valley component of wind speed. Mass fluxes were computed for individual layers, i of depth z, assuming a constant valley width of a =1000 m. From the vertical wind profiles, the mass fluxes are extrapolated from the top of the profiles (~ 500 m) to the rim height of the valley (~1000 m AGL).
Mass Flux in Valley Wind (Yosemite 1998) Yosemite Valley 0955 PST Profiles of mass flux show that a maximum occurs at ~ 200 m AGL with the development of the up-valley wind at 1035 PST. Up-valley winds in Yosemite Valley may produce total mass fluxes of ~ 5.0 x 10 8 kg h-1. This estimate may lead to a better approximation of pollutant transport into the valley atmosphere. Height (m AGL) 1035 PST
700 600 PST 600 630 500 700 400 725 Height (m AGL) 300 955 1035 200 100 0 282 284 286 288 290 292 294 296 298 2 3 4 5 6 7 8 -6 -4 -2 0 2 4 6 Mixing Ratio(g kg-1) Up-valley Wind Component (m s-1) Potential Temperature (K) Tethersonde Profiles from Yosemite Valley
Boundary-Layer Evolution: Lee Vining Canyon, 5-6 June 1998 Down-valley Up-valley Height (m AGL) Down-valley Up-valley Up-valley Wind Component (m s-1) Mixing Ratio(g kg-1) Potential Temperature (K)
Inversion destruction Models in mountain Valleys (Whiteman 1982): Pattern 1
Inversion destruction Models in mountain Valleys (Whiteman 1982): Pattern 2
Inversion destruction Model in mountain Valleys (Whiteman 1982): Pattern 3
Diurnal Temperature Evolution in Mountain Valleys (from Stull 1988; adapted from Whiteman 1982)
A Simplified Heat Budget of the Valley Atmosphere Term 1: local rate of change of potential temperature Term 2: convergence of potential temperature flux by mean wind Term 3: convergence of radiative flux Term 4: convergence of turbulent sensible heat flux
The thermodynamic model developed by Whiteman and McKee (1982):
Modeled Inversion destruction (a) Inversion breakup according to Eq. 2 with Ao = 0.45, (a) = 0.007 K m-1 and (b) = 0.015 K m-1 TAF () values are indicated in legend. (b)
Diurnal Evolution of the Boundary Layer over Mountains Whiteman(2000)
Do valley winds always follow the classic understanding in all mountain areas? Do winds always flow up valley during the day and down valley during the night? Of course not! One example is the Washoe Zephyr wind system.
Frequency distributions of winds from the southwest to northwest quadrant as a function of year and hour of day for (a) all seasons.
Frequency distributions of winds from the southwest to northwest quadrant as a function of year and hour of day for (b) the summer season.
Frequency distributions of westerly winds 5 ms1 at Galena for each hour of the day for all seasons and for 2003–05
(top) Difference of sea level pressure between Sacramento and Reno, (second from top) 700-mb wind speed and direction from Reno soundings at 0000 UTC on each day, and surface westerly downslope wind for each hour of the day for (third from top) Reno and (bottom) Lee Vining for summer of 2003.
RAMS simulated wind speed and (c),(d) potential temperature on an east–west cross section through the center of the domain at (left) 1200 and (right) 2000 LST.
Findings Washoe Zephyr is generally not caused by downward momentum transfer as the deep afternoon convective boundary layer on the lee slope of the Sierra Nevada and in the Great Basin penetrates into the layer of westerlies aloft. Instead, the difference in elevation between the elevated, semi-arid Great Basin on the eastern side and the lower region on the western side of the Sierra Nevada provides a source of asymmetric heating across the mountain range. The asymmetric heating evolves during daytime, generating a regional pressure gradient that allows air from the west to cross over the crest and to flow down the eastern slope in the afternoon. Although a westerly ambient wind is not necessary for the development of Washoe Zephyr, its presence leads to strong Washoe Zephyr events that start earlier in the afternoon and that last longer.
Summary In mountainous regions, local wind systems develop in response to local heating of the terrain. The winds in these areas are ‘usually’ classified as: Valley winds Slope winds And there are special cases when the winds blow differently than Expected.