Download
1 / 11
110 likes | 360 Views
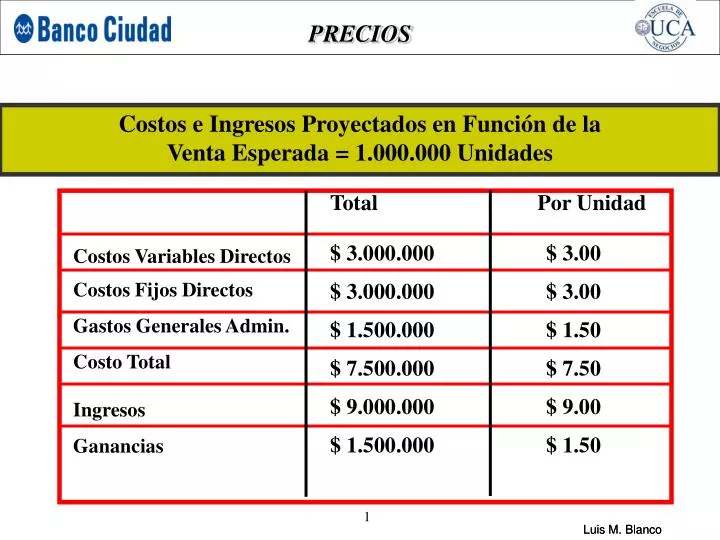
PRECIOS. Costos e Ingresos Proyectados en Función de la Venta Esperada = 1.000.000 Unidades. Total Por Unidad $ 3.000.000 $ 3.00 $ 3.000.000 $ 3.00 $ 1.500.000 $ 1.50 $ 7.500.000 $ 7.50 $ 9.000.000 $ 9.00 $ 1.500.000 $ 1.50.

E N D
PRECIOS Costos e Ingresos Proyectados en Función de la Venta Esperada = 1.000.000 Unidades Total Por Unidad $ 3.000.000 $ 3.00 $ 3.000.000 $ 3.00 $ 1.500.000 $ 1.50 $ 7.500.000 $ 7.50 $ 9.000.000 $ 9.00 $ 1.500.000 $ 1.50 Costos Variables Directos Costos Fijos Directos Gastos Generales Admin. Costo Total Ingresos Ganancias
PRECIOS Costos e Ingresos Reales por Ventas Reales = 750.000 unidades Total Por Unidad $ 2.250.000 $ 3.00 $ 3.000.000 $ 4.00 $ 1.500.000 $ 2.00 $ 6.750.000 $ 9.00 $ 6.750.000 $ 9.00 0 0 Costos Variables Directos Costos Fijos Directos Gastos Generales Admin. Costo Total Ingresos Ganancias ¿Cómo solucionaría usted este problema?
PRECIOS Implicancias Financieras de un Aumento de Precio del 10% A B Actual Baja de 5% Baja de 33% en unidades en unidades Vendidas Vendidas Precio $ 9.00 Unidades Vendidas 750.000 Costos Variables $ 3.00 Costos Fijos $ 4.00 Gastos Generales $ 2.00 Administrativos Costo por Unidad $ 9.00 Ganancia por Unidad 0 Ganancia Total 0
PRECIOS Implicancias Financieras de una Rebaja del 10% Actual Suba de 5% Suba de 33% en Unidades en Unidades Vendidas Vendidas Precio $ 9.00 Unidades Vendidas 750.000 Costos Variables $ 3.00 Costos Fijos $ 4.00 Gastos Generales $ 2.00 Administrativos Costo por Unidad $ 9.00 Ganancia por Unidad 0 Ganancia Total 0
PRECIOS 2. DETERMINAR EL MARGEN DE CONTRIBUCION Por Unidad Total • Precio de venta • Costo de incremento variable • Margen de Contribución • Ingreso de venta • Costo total variable • Contribución total Por Unidad %MC = Margen de Contribución Precio X 100 Total %MC = Contribución Total Ingreso por Ventas X 100
PRECIOS Precio Costo Variable por unidad MC = CF + Ganancia Venta de Unidad
PRECIOS Ganancia Neta Producto 1 Ganancia Neta Producto 2
PRECIOS Precio Costo Variable Margen de Contribución Producto 1 Precio Costo Variable Margen de Contribucion Producto 2
PRECIOS LA PREGUNTA • ¿GANAR MARKET SHARE, O EL % DE MERCADO QUE ME INTERESA? • Y • ¿CUAL ES EL MERCADO QUE ME INTERESA?
PRECIOS • 1. El efecto percibido de los sustitutos • 2. El efecto del valor único • 3. El efecto de los costos fijos por cambio de proveedor • 4. El efecto de la comparación difícil • 5. El efecto precio-calidad • 6. El efecto del gasto • 7. El efecto fin-beneficio • 8. El efecto del costo compartido • 9. El efecto de la equidad • 10. El efecto inventario DETERMINANTES DE LA SENSIBILIDAD DE LOS PRECIOS
CORREO ELECTRONICO lb@blancoyasoc.com TE: 4314-0090 (lin. rot.) www.blancoyasoc.com