1 / 2

Understanding Positive and Negative Peak Medians in Flow Cytometry Analysis

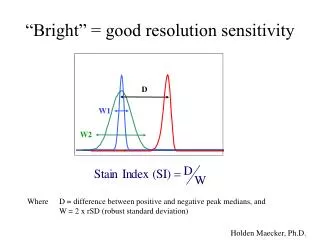
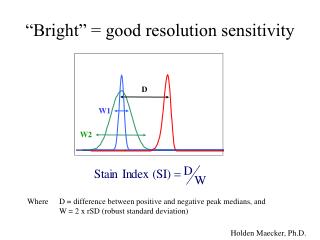
Learn about the differences between positive and negative peak medians, as well as the W=2 x rSD (robust standard deviation) for improved resolution sensitivity in flow cytometry. Explore insights from Dr. Holden Maecker on using various fluorochromes and stain index.

pomona
Download Presentation

Understanding Positive and Negative Peak Medians in Flow Cytometry Analysis

An Image/Link below is provided (as is) to download presentation Download Policy: Content on the Website is provided to you AS IS for your information and personal use and may not be sold / licensed / shared on other websites without getting consent from its author. Content is provided to you AS IS for your information and personal use only. Download presentation by click this link. While downloading, if for some reason you are not able to download a presentation, the publisher may have deleted the file from their server. During download, if you can't get a presentation, the file might be deleted by the publisher.

E N D

Presentation Transcript


  1. W1 W2 Where D = difference between positive and negative peak medians, and W = 2 x rSD (robust standard deviation) “Bright” = good resolution sensitivity D Holden Maecker, Ph.D.

  2. Various fluorochromes-stain index

More Related