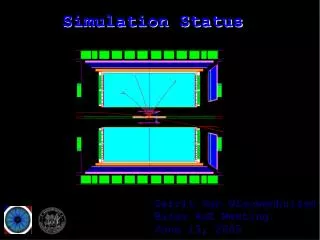
Simulation status
Simulation status. 22Feb06 Takashi Matsushita. Purpose. To study tracker performance with different spacing Now Geoff’s proposal ============== 1-2 | 45 47 2-3 | 35 20 3-4 | 20 18 4-5 | 10 15. Reproduce results at Berkeley.


Simulation status
E N D
Presentation Transcript
Simulation status 22Feb06 Takashi Matsushita
Purpose • To study tracker performance with different spacing Now Geoff’s proposal==============1-2 | 45 472-3 | 35 203-4 | 20 184-5 | 10 15
Reproduce results at Berkeley • Simulation setup • Input beam;matched 2.5 pi mm rad. data10k events • G4MICE;version = Malcolm-demo-T20050208(newer than the one used for Berkeley)
Generated distributions • x, y, px, py, pt, pzs(x) = 20.7 mms(y) = 20.9 mms(px) = 18.0 MeV/cs(py) = 17.7 MeV/cs(pt) = 11.6 MeV/cs(pz) = 1.48 MeV/c
Reconstructed distribution • x, y, px, py, pt, pz • Events with reconstuction failure are not included rec. gen.===============s(x) = 20.9 [20.7]s(y) = 21.2 [20.9]s(px)= 18.4 [18.0]s(py)= 18.3 [17.7]s(pt)= 12.6 [11.6]s(pz)= 28.9 [1.48]
Residuals distributions • x, y, px, py, pt, pz • Events with reconstuction failure are not included resolution ===============s(x) = 3.66 [mm]s(y) = 4.02 [mm]s(px)= 4.27 [MeV/c]s(py)= 4.79 [MeV/c]s(pt)= 5.39 [MeV/c]s(pz)= 28.6 [MeV/c] • => needs selection criteria to cut tails
Track quality • # of points used for track fit, chi^2/dof,reconstructed pz, estimated error on pz, dpz/pz in different range
dpz/pz for different #of points • dpz/pz dependence on # of points used for track reconstruction • dpz/pz gets better as # of points increase • require # of points = 5
pz related values vs true pt • correlation between; pz and pt(true), dpz and pt(true), dpz/pz and pt(true)in scatter and profile plots • require dpz/pz<0.25
distribution of rejected events y px x pt py pz
Reconstructed distribution • x, y, px, py, pt, pz with # of points = 3 and dpz/pz < 0.25 cuts [no cuts]===============s(x) = 21.5 [20.9]s(y) = 22.0 [21.2]s(px)= 19.8 [18.4]s(py)= 19.4 [18.3]s(pt)= 10.4 [12.6]s(pz)= 6.10 [28.9]
Residuals distributions • x, y, px, py, pt, pz with # of points = 3 and dpz/pz < 0.25 cuts resolution [no cuts] ===============s(x) = 0.56 [3.66]s(y) = 0.45 [4.02]s(px)= 2.23 [4.27]s(py)= 1.61 [4.79]s(pt)= 1.94 [5.39]s(pz)= 5.86 [28.6]
Comparison with Berkeley • this analysis Berkeley============================= s(x) = 0.56 0.54s(y) = 0.45 0.44s(px) = 2.2 2.1s(py) = 1.6 1.5s(pt) = 1.9 1.8s(pz) = 5.9 4.6 good agreement • s(X) dependence on dpz/pz cut in progress
Station spacing • Taming “Reconstruction” program of G4MICE to work with different station spacing… • Special thanks;Malcolm and Chris