Download
1 / 20
210 likes | 394 Views
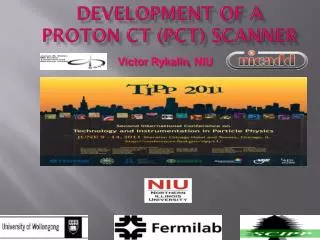
Development of a Head Scanner for Proton CT. Hartmut F.-W. Sadrozinski R. P. Johnson, S. Macafee, A. Plumb, H. F.-W. Sadrozinski, D. Steinberg, A. Zatserklanyi SCIPP, UC Santa Cruz, CA 95064 USA V. Bashkirov, F. Hurley, R. Schulte Loma Linda University Medical Center, CA 92354 USA

E N D
Development of a Head Scanner for Proton CT Hartmut F.-W. Sadrozinski R. P. Johnson, S. Macafee, A. Plumb, H. F.-W. Sadrozinski, D. Steinberg, A. Zatserklanyi SCIPP, UC Santa Cruz, CA 95064 USA V. Bashkirov, F. Hurley, R. Schulte Loma Linda University Medical Center, CA 92354 USA K. Schubert, M. WittCSU San Bernardino, San Bernardino, CA 92407, USA S. Penfold CMR, Univ. of Wollongong NSW 2522, Australia Hartmut F.-W. Sadrozinski: pCT HSTD8 Dec. 2011
Large-scale Imaging with Silicon Sensors Energy Loss of Protons, r Attenuation of Photons, Z N(x) = Noe- m x Bethe-Bloch NIST Data Measure energy loss on individual protons Measure statistical process of X-ray removal Hartmut F.-W. Sadrozinski: pCT HSTD8 Dec. 2011
RSP Alderson Head Phantom H Proton CT Basics Proton therapy and treatment planning requires the knowledge of the stopping power in the patient, so that the Bragg peak can be located within the tumor.X-ray CT has been shown to give insufficiently accurate stopping power (S.P.) maps in complicated phantoms or from uncertainty in converting Hounsfield values to S.P. Range Uncertainties (measured with PTR) > 5 mm > 10 mm > 15 mm Schneider U. (1994), “Proton radiography as a tool for quality control in proton therapy,” Med Phys. 22, 353. The goal of Proton CT is to reconstruct a 3D map of the stopping power within the patient with as fine a voxel size as practical at a minimum dose, using protons (instead of x-rays) in transmission.In a rotational scan the integrated stopping power is determined for every view by a measurement of the energy loss. Hartmut F.-W. Sadrozinski: pCT HSTD8 Dec. 2011
pCT Challenge #1: Multiple Coulomb Scattering The proton path inside the patient/phantom is not straight the path of every proton before and after the phantom has to be measured and its path inside the patient reconstructed. From deflection and displacement, calculate the “Most Likely Path MLP” Beam test with sub-divided phantom: MLP can be predicted with sub-mm precision using tracking detectors with ~ 80mm resolution D C Williams Phys. Med. Biol. 49 (2004) 2899–2911 Hartmut F.-W. Sadrozinski: pCT HSTD8 Dec. 2011 M. Bruzzi et al IEEE Trans. Nucl. Sci.,54, 140 (2007)
pCT Challenge #1a: Proton Data rate Tracking and measuring the residual energy of every proton requires fast sensors and fast data acquisition (DAQ).Data Flow math:Assuming 100 protons / 1mm voxel and 180 views requires ~ 7*108 protons.With 10 kHz data rate, one pCT scan will take 20 hrs (requiring a very patient patient!).A scan with a proton rate of 2 MHz takes 6 min. N.B. such a scan will deliver a dose of 1.5 mGy.Image ReconstructionTo reconstructimages with > 107 voxels using ~109 protons is NOT trivial. Our reconstruction code is already running on GPU’s in anticipation of the much higher data rates of the future. Hartmut F.-W. Sadrozinski: pCT HSTD8 Dec. 2011
Challenge #2 to pCT: Range / Energy Straggling The proton energy loss is not fixed, but is a stochastic process. The straggling error is a function of depth, irreducible when the energy is not measured. the straggling within the phantom limits the precision of the energy loss measurement. Range counter always encounters the maximum range straggling: the error is independent of the WEPL of phantom (depends on proton energy) Geant4 Study: Range straggling ~ 1% of range~ 1mm for 100 MeV, ~ 3mm for 200 MeV WEPL = Water equivalent Path Length (of proton in phantom) Hartmut F.-W. Sadrozinski: pCT HSTD8 Dec. 2011
pCT Challenge #2a: useful Proton Rate Efficiency of energy measurementIn addition to ionization processes described by the Bethe-Bloch equation, protons undergo processes which remove protons from the peak in the energy spectra useful for the energy determination. Because of non-Gaussian tails, the energy distributions at present are fitted only at the high side, which comes with a loss of precision. With improved modeling of the tails, this might be recoverable. Geant4 Range Counter Data CsI Calorimeter Simulation and data agree well: At 200 MeV, only ~60% of the protons entering the phantom will be in the quasi-Gaussian end peak of the spectrum. Hartmut F.-W. Sadrozinski: pCT HSTD8 Dec. 2011
Instrument Solutions to the pCT Challenge: Hartmut F.-W. Sadrozinski: pCT HSTD8 Dec. 2011
Imaging Results (LLU-UCSC-NIU) B. Colby, D. Fusi, R. Johnson, S. Kashiguine, F. Martinez-McKinney, J. Missaghian, H. F.-W. Sadrozinski, M. Scaringella SCIPP, UC Santa Cruz, CA 95064 USA V. Bashkirov, F. Hurley, S. Penfold, R. Schulte Loma Linda University Medical Center, CA 92354 USA G. Coutrakon, B. Erdelyi, V. Rykalin Northern Illinois University S. McAllister, K. Schubert CSU San Bernardino 2003 2010 Hartmut F.-W. Sadrozinski: pCT HSTD8 Dec. 2011
The LLU-UCSC-NIU Prototype Scanner R. W. Schulte, et al.,, IEEE Trans. Nucl. Sci., 51,, pp 866, 2004. Hartmut F.-W. Sadrozinski: pCT HSTD8 Dec. 2011
air lucite polyst. bone CT Image Reconstruction • WEPL calibration and cut • Correction for overlaps in Si tracker • Correction matrix with Calorimeter response • Angular and spatial binning • Filtered Back Projection and Iterative Algebraic reconstruction • MLP formalism for final reconstruction 2.5 mm slice 0.65 mm voxels Reality Check: We accumulated data for this reconstructed image during 4 hours at 20 kHz trigger rate. This is not acceptable for clinical applications ! Next development step: 50x faster pCT scanner 11 Hartmut F.-W. Sadrozinski: pCT HSTD8 Dec. 2011
LLU-UCSC-CSUSB Head Scanner NIH Grant 1R01EB013118-01 R. Johnson, H. F.-W. Sadrozinski, D. Steinberg, A. Zatserklanyi, V. Bashkirov, F. Hurley, S. Penfold, R. Schulte, S. McAllister, K. Schubert Increase Size 2x : 40 cm x 10 cm Improve data throughput 50x: 2MHz sustained proton rate with minimal pile-up Si sensors are intrinsically fast, built faster readout ASIC and distributed DAQ Data stream uses local FPGA for data collection, formatting and transmission Improve speed of energy detector: CsI calorimeter replaced with faster plastic scintillator Both range counter and range counter-calorimeter hybrid under test Polystyrene Range Counter with direct MPPC readout looks very promising (~3x p.e. wrt to WLSF readout?) Geant4 results on Range Counter with thicker tiles is intriguing Improve tiling of Si sensors: Si SSD are attractive since they have low noise at good efficiency, an important factor in a sparse system (no redundant space points) “slim edges” allow tiling without overlap Hartmut F.-W. Sadrozinski: pCT HSTD8 Dec. 2011
70 plates, 4 mm, ~ 30 p.e. Polystyrene Scint. SiPM WEPL (not Energy!) Detector Choices Hodoscopic CsI Calorimeter P.D. Readout Too slow! Range Counter Direct MCPP readout (signal 3-5x of 3mm+WLSF) Range-Calorimeter Hybrid “Bulky”: 3 Polystyrene 10cmx10cmx40cm + PM Proton path 3 - 4” PMT Hartmut F.-W. Sadrozinski: pCT HSTD8 Dec. 2011
WEPL Calibration of “Bulky”200 MeV Protons, Polystyrene Degraders of known Water Equivalent Thickness WET Goal of WEPL calibration: Determination of WEPL directly from calorimeter response, without converting first to MeV Comparison of WEPL Resolution Range Counter WEPL RMS is constant ~ 4 mm (as expected, since range counter is dominated by straggling in phantom/degrader + range counter (expect ~ 1mm from plate thickness) “Bulky” appears to be a good choice, if spill-over can be dealt with when range is close to calorimeter interface Hartmut F.-W. Sadrozinski: pCT HSTD8 Dec. 2011
Silicon Tracker Improvements Large area coverage requires tiling of sensors. Sensors have ~ 1mm inactive edges which create image artifacts. In the present prototype tracker this is dealt with by shingling sensors, but a reconstruction nightmare. Overlapping sensors introduces additional, non-uniform energy corrections Hartmut F.-W. Sadrozinski: pCT HSTD8 Dec. 2011
For Tiling with no Overlap: “Slim Edges”see M. Christophersen’s Talk Si SSD with 900mm dead edge Cut within 50 mm of Guard Ring Guard Ring Cut (!) XeF2 scribing + Cleaving + N2 PECVD with guard ring without guard ring Reduce dead edge from 1mm to ~ 200 mm Excellent breakdown behavior Current at 150V: ~10 nA/cm with guard ring ~100 nA/cm without guard ring Hartmut F.-W. Sadrozinski: pCT HSTD8 Dec. 2011
Charge Collection of “Slim Edge” HPK Sensor Treatment: Laser scribed w 10% intensity Cleaved with tweezers Oxygen PECVD on Sidewall Cut ~ 100 mm from guard ring GLAST2000, p-on-n; t = 400 mm; L = 10 cm; Pitch: 228 mm; # of strips:8 1) Measure i-V for entire sensor and for every strip: Is any current leaking into the active region? 2) Investigation of the Charge collection pre- and post- cutting using the AliBaVa analog readout system Hartmut F.-W. Sadrozinski: pCT HSTD8 Dec. 2011
Currents on Individual Strips The currents on the cut sensor are 1000x larger wrt un-cut. The currents on individual strips are measured through the bias resistor voltage measurements. They are generally consistent for both cut and un-cut devices. We do not see an abnormal behavior for the edge strips. Device i-V uncut-cut Strip i-V uncut-cut P-on-n HPK (GLAST), laser scribed, PECVD Oxygen, 96mm from guard Hartmut F.-W. Sadrozinski: pCT HSTD8 Dec. 2011
Outer Strip Signal pre-cut / post-cut Data taken and analyzed by R. Mori (Florence U.) & M. Cartiglia (Milano H.S.) Strip # 203 is next to the cut edge 150 V bias, 90Sr source Tail in pulse height distribution from partially measured tracks close to the bias ring is unchanged before/after cut Cutting does not change the noise in the adjacent outer strip Median does not change by more than 5% from before to after cut Hartmut F.-W. Sadrozinski: pCT HSTD8 Dec. 2011
Conclusions • Proton CT has come a long way since I first talked about it at the 2002 IEEE NSS-MIC Symposium in Norfolk, VA. • We see very different approaches on instruments, motivated in part by a technology transfer from HEP/Space. This has come with severe limitations (proton rate!). • Using our prototype scanner, we are starting to reconstruct very clear and sophisticated radiographs AND CT images, and are actively improving reconstruction algorithms. • We are now arriving at a new phase in pCT: we have a dedicated detector development, with focus on speeding up the data taking to be useful in clinical applications, and optimizing the detector systems based on lessons learned. • End-to-end simulation of the instrument has been essential for our understanding of the requirements and proper choice of the technical solution, yet many lessons were learned during operation of the scanners • Next (big) step: clinical application. Ongoing and unwavering support by Prof. James M. Slater (LLUMC) made this project possible. We acknowledge support from the US National Institute of Health under the grant NIH Grant 1R01EB013118-01 Hartmut F.-W. Sadrozinski: pCT HSTD8 Dec. 2011