Download
1 / 35
350 likes | 612 Views
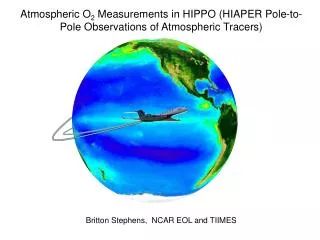
Global observations of climatically important atmospheric gases and aerosols during HIPPO. Britton Stephens (NIWA/NCAR) and HIPPO Science Team. PIs: Harvard, NCAR, Scripps, NOAA, others

E N D
Global observations of climatically important atmospheric gases and aerosols during HIPPO Britton Stephens (NIWA/NCAR) and HIPPO Science Team
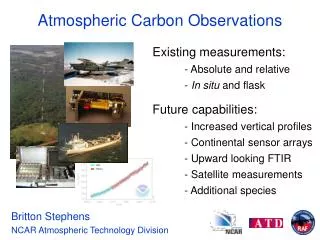
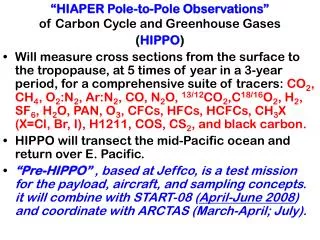
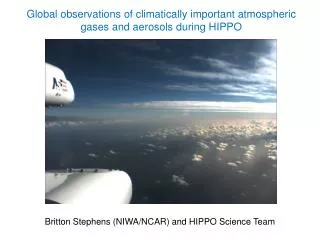
PIs: Harvard, NCAR, Scripps, NOAA, others • Global and seasonal survey of CO2, O2, CH4, CO, N2O, H2, SF6, COS, CFCs, HCFCs, O3, H2O, CO2 isotopes, Ar, black carbon, and hydrocarbons • NSF / NCAR Gulfstream V • 5 campaigns over 4 years • Continuous profiling from surface to 10 km, and to 15 km twice per flight • hippo.ucar.edu (also Facebook, Twitter, YouTube) Canterbury, New Zealand Pago Pago, American Samoa Brooks Range, Alaska
Tropical Land and Northern Land fluxes plotted versus annual-mean northern-hemisphere vertical CO2 gradient Continental-scale carbon flux uncertainties are still very large, owing to biases in atmospheric CO2 transport [Stephens et al., 2007]
NSF/NCAR Gulfstream V Jet (GV) (HIAPER = High-performance Instrumented Airborne Platform for Environmental Research)
HIPPO Science Team: Harvard University: S. C. Wofsy, B. C. Daube, R. Jimenez, E. Kort, J. V. Pittman, S. Park, R. Commane, Bin Xiang, G. Santoni; (GEOS-CHEM) D. Jacob, J. Fisher, C. Pickett-Heaps, H. Wang, K. Wecht, Q.-Q. Wang National Center for Atmospheric Research: B. B. Stephens, S. Shertz, P. Romashkin, T. Campos, J. Haggerty, W. A. Cooper, D. Rogers, S. Beaton , R. Lueb NOAA ESRL and CIRES: J. W. Elkins, D. Fahey, R. Gao, F. Moore, S. A. Montzka, J. P. Schwartz, D. Hurst, B. Miller, C. Sweeney, S. Oltmans, D. Nance, E. Hintsa, G. Dutton, L. A. Watts, R. Spackman, K. Rosenlof, E. Ray UCSD/Scripps: R. Keeling, J. Bent Princeton: M. Zondlo, Minghui Diao U. Miami: E. A. Atlas TCCON: Vanessa Sherlock et al. JPL: M. J. Mahoney; (AIRS) M. Chahine, E. Olsen Cooperating modeling groups: ACTM P. Patra, K. Ishijima; GEMS-MACC R. Engelen; TM3/TM5 Sara Mikaloff-Fletcher;
Harvard/Aerodyne - QCLS CO2, CH4, CO, N2O (1 Hz) NCAR AO2 O2:N2 , CO2 (1 Hz) Harvard OMS CO2 CO2 (1 Hz) NOAA CSD O3 O3 (1 Hz) NOAA GMD O3 O3 (1 Hz) NCAR RAF CO CO (1 Hz) NOAA- UCATS, PANTHER GCs (1 per 70 – 200 s) CO, CH4, N2O, CFCs, HCFCs, SF6, CH3Br, CH3Cl, H2, H2O Whole air sampling: NWAS (NOAA), AWAS (Miami), MEDUSA (NCAR/Scripps) O2:N2, CO2, CH4, CO, N2O , other GHGs, CO2 isotopes, Ar/N2, COS, halocarbons, solvent gases, marine emission species, many more Princeton/SWS VCSEL H2O (1 Hz) NOAA SP2 Black Carbon (1 Hz) MTP, wing stores, etc T, P, winds, aerosols, cloud water HIPPO Aircraft Instrumentation
HIPPO_2 Nov 2009 HIPPO_3 Mar/Apr 2010 (same track NB, SB) HIPPO_4 Jun 2011 (NB track TBD) HIPPO_5 Sep 2011 (NB track TBD) ~ 600 vertical profiles; nearly 1000 at HIPPO's conclusion.
HIPPO_1 Xsects along the Dateline Jan 2009
HIPPO_1 Xsects along the Dateline Jan 2009
HIPPO_2 Xsects along the Dateline Nov 2009
Pollution over the Arctic N2O CO CH4
HIPPO1 AO2 Profiles at 80 N January 12, 2009
HIPPO1 AO2 Profiles at 65 S Southern Ocean O2 outgassing January 20, 2009
O2 Cross Section, January, 2009 per meg
APO Cross Section, January, 2009 per meg Atmospheric Potential Oxygen: APO = O2 + 1.1*CO2
HIPPO2 and HIPPO3 AO2 Profiles at 67 S November 2009 April 2010
CFC-11 Halon-1211 Whole-Air Sampling NWAS / AWAS (E. Atlas, S. Montzka) Mid-Pacific Sample coverage
Ethyne Methyl chloroform Benzene Dichloromethane
Dimethyl Sulfide Carbonyl Sulfide Methyl Nitrate Carbon Disulfide
Models with detailed simulations of HIPPO Data • Earth Simulator – ACTM CCSR/NIES/FRCGC AGCM – P. Patra • GEOS-CHEM (NASA DAO) - Harvard Team • MACC-GEMS ECMWF Air Quality and Air Chemistry – R. Engelen • TM3 (NIWA), TM5 planned – S. Mikaloff-Fletcher Detailed Model results for HIPPO_1: CO2 SF6 C2H6 CO N2O CH4 O3 PAN NOx HCHO BlkC O2 GEOS_C 1 1 1 1 0 1 0 0 0 0 * ACTM 1 1 0 0 1 1 0 0 0 0 MACC 0 0 1 1, Fcst 0 1 1 1 1 1 TM3 1 0 0 0 0 0 0 0 0 0 1
offset 31 ppb HIPPO Obs CH4 ACTM sources and vertical and horizontal transport
Profiles over Ocean Arctic Boundary Layer Plume at 23N, 10km Plume RF04, 8km NH Tropical Troposphere
Preliminary APO comparison January Mean APO from Climatological fluxes in TM3 HIPPO1 APO Observations per meg Fluxes: Mean ocean O2: Gruber et al., 2001 Seasonal ocean O2 and N2: Garcia and Keeling, 2001 Mean ocean N2: Gloor et al., 2001 Seasonal + mean ocean CO2: Takahashi et al., 2009 Fossil-fuel CO2 and O2: CDIAC
Summary: • 3 of 5 HIPPO campaigns completed and data are revealing a wealth of information • A new type of data: global, high-precision, fine-grained, and many species • Clearly dilineate transport processes (warm-conveyor belt, strat-trop exchange, Arctic cold-dome, marine and continental PBL) and source regions (tropical N2O, marine reactive species, Southern Ocean O2 and CO2) in ways not achieved beforeExpected to challenge models of carbon fluxes and of atmospheric transport and chemistry • Data will be publicly available 12-18 months post flight • We welcome collaboration with atmospheric, oceanic, and terrestrial modelers and with those making measurements on other platforms
NCAR Airborne Oxygen Instrument (AO2) System components: