Download
1 / 45
490 likes | 766 Views
Aerosols Observations from Satellites. Pawan Gupta NASA ARSET- AQ – EPA Training September 29 - October 1, 2014. ARSET - AQ A pplied R emote S ensing E ducation and T raining – A ir Q uality A project of NASA Applied Sciences. Aerosol Optical Depth. AOD - Aerosol Optical Depth

E N D
Aerosols Observations from Satellites Pawan Gupta NASA ARSET- AQ – EPA Training September 29 - October 1, 2014 ARSET - AQ AppliedRemoteSensingEducationandTraining –Air Quality A project of NASA Applied Sciences
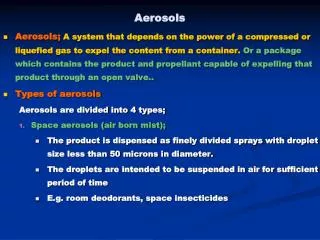
Aerosol Optical Depth • AOD - Aerosol Optical Depth • AOT - Aerosol Optical Thickness • These optical measurements of light extinction • are used to represent aerosol amount in the entire • column of the atmosphere.
Moderate AOD ~0.40 Near Mt. Abu, India Photo courtesy of Brent Holben
Optical Depth Sun • The optical depth expresses the quantity of light removed from a beam by scattering or absorption during its path through a medium. • optical depth τ as Atmosphere I0 I Surface
Transmission, Reception, and Processing (E) (A) Energy Source or Illumination Remote Sensing Process from week 1 (D) Recording of Energy by the Sensor Interpretation and Analysis (F) (B) Radiation and the Atmosphere (C) Interaction with the Target Application (G) Reference: CCRS/CCT
Aerosol Retrieval Start with aerosol detection …
Land Water Smoke Satellite Observations & Pollution Clouds MODIS-Terra, May 08, 2007
Complex Image: Smoke & Clouds MODIS-Terra, May 14, 2007
MODIS-Terra, May 2, 2007 High Low Radiance -to- Aerosol Products No Retrievals
Aerosol retrieval algorithm is a complex inversion scheme where assumptions are made in simulating satellite observations with advance radiative transfer calculations to retrieve atmospheric aerosol properties Remer et al., 2005, Levy et al., 2013
Levels of Data April 12, 2014 High Low Level 2 Level 3 Level 1B No Retrievals Aerosol Retrieval Algorithm Spatial & Temporal Averaging Calibration to Radiance
Data Product Hierarchy Level 1 Products - Raw data with and without applied calibration. – NO AEROSOL DATA Level 2 Products - Geophysical Products - AEROSOL DATA Level 3 Products - Globally gridded geophysical products - AEROSOL DATA
Satellites for air quality data • MODIS (Terra and Aqua) • AOD: columnar aerosol loading – can be used to get particulate matter mass concentration • MISR (Terra) • Columnar aerosol loading in different particle size bins • in some cases aerosol heights • OMI (Aura) • Absorbing aerosols • Trace gases • VIIRS (NPP) • Aerosol Optical Depth, Aerosol Type
Instrument Capabilities for Air Quality Sensor Measurement Resolution • MODIS – 250m-1 KM Resolution • MISR- 275m- 1.1 KM Resolution • OMI – 13 x 24 KM Resolution • VIIRS – 750 m
MODIS – MODerate resolution Imaging Spectroradiometer Newer Earth-observing satellite remote sensing instruments typically make observations at many discrete wavelengths or wavelength bands. 36 wavelength bands covering the wavelength range 405 nm (blue) to 14.385 μm (infrared)
Few more things to know about MODIS DATA MOD - Terra product MYD - Aqua product • All MODIS products come in HDF format • In HDF format each file contains both data and metadata • SDS - Each parameter within a MODIS HDF file is referred to as an SDS (Scientific Data Set) • An SDS must be referenced precisely according to name when analyzing the data with your own computer code.
Things that change with each instrument And therefore you need to learn! • Calibration accuracy. • Quality Assurance – product creators estimate • of the quality of the data. • Data formats. • Product Resolutions. • How level 3 products are created from level 2 • temporally and spatially. • Current release of the data and data history.
MODIS Aerosol Products Three Separate Algorithms Land Ocean Dark Target Deep Blue – Used over bright land surfaces Currently the dark target and deep blue products are separate. When both are available the user must select which one to use In collection 6 there will be a joint product that uses an automated procedure to select the appropriate product.
MODIS Aerosol Products Two Algorithms DeepBlue Deep_Dark_Combined Dark Target
MODIS 10 KM vs 3 KM Products
Quality Assurance is Extremely Important!! QA indicates the confidence in the quality of the retrieval. Quality_Assurance_Land Scale is 0 - 3 Recommend Land QA of 3 Factors: Number of pixels Error fitting Surface reflectance Quality_Assurance_Ocean Scale is 0 - 3 Recommend Ocean QA above 1, 2, 3 Factors: Number of pixels Error fitting How close to glint
Time Collection Product Name Date - year, Julian day File processing information Understanding a MODIS File Name Terra - MOD04 Aqua - MYD04 3 km Product Name MOD04_3K MOD04_L2.A2001079.0255.006.2006289012028.hdf HDFLook, Panoply, IDL, Python, Fortran, Mat Lab etc. can be used to read the data
MODIS Aerosol Parameters (SDS) Optical_Depth_Land_And_Ocean (with recommended quality flags over land and ocean) Over Land QA = 3, Over Ocean QA = 1, 2, 3 Dark_Target_Deep_Blue_Optical_Depth_550_Combined (Deep Blue & Dark Target Algorithm merged product) Dark_Target_Deep_Blue_Optical_Depth_550_Combined_QA (Quality Flag associated with DD product) Reference: http://www.atmos-meas-tech.net/6/2989/2013/amt-6-2989-2013.html
Access to MODIS Aerosol Products • NASA LAADSWEB. Searchable data base, FTP access http://ladsweb.nascom.nasa.gov/index.html • MODIS-Atmos Site: Complete RGB archive and Level 3 product imagery. http://modis-atmos.gsfc.nasa.gov/ • Giovanni – web tool for imagery visualization and analysis http://gdata1.sci.gsfc.nasa.gov/daac-bin/G3/gui.cgi?instance_id=MODIS_DAILY_L3
Ozone Monitoring Instrument (OMI) One of four sensors on the EOS-Aura platform (OMI, MLS, TES, HIRDLS) An international project: Holland, USA, Finland Launched on 07-15-04 • Instrument Characteristics • -Nadir solar backscatter spectrometer • -Spectral range 270-500 nm (resolution~1nm ) • Spatial resolution: 13X24 km footprint • Swath width: 2600 km (global daily coverage) Retrieval Products Column Amounts -Ozone (O3) -Nitrogen Dioxide (NO2) -Sulfur Dioxide: (SO2) -Others Aerosols
Applications of the Aerosol Index • Validation tool for transport models • Separation of carbonaceous from sulfate aerosols • Identification of aerosols above PBL (i.e., PBL aerosols are not detectable by AI) • Tracking of aerosol plumes above clouds and over ice/snow Aerosol s over clouds: April 14, 2006 Transport around the globe of a high altitude smoke layer generated by the Australian fires in December 2006. Numbers indicate the day of the month.
OMI data site http://disc.sci.gsfc.nasa.gov/Aura/data-holdings/OMI OMI-Aura_L2-OMAERUV_2011m1024t0521-o38692_v003-2011m1024t115317.he5 Product name YYYYmMMDDtHHMM
Angular observations (which are not available in MODIS) makes MISR capable of providing additional information on particle size, shape and aerosol height under specific cases
Aerosol Heights from MISR Smoke Signals from the Alaska and Yukon Fires - July 2004
Level 2 & 3 aerosol 1 file = one orbit - about 98 min Data 17.6x17.6 km2 , 0.5x0.5, and 1x1deg, daily, monthly, seasonal MISR_AM1_AS_AEROSOL_P028_O002510_F12_0022.hdf RegBestEstimateSpectralOptDepth (AOD – 4 wavelengths) RegBestEstimateSpectralOptDepthFraction (AOD fraction for small, medium, large, spherical, and non-spherical particles) Data access and handling tutorial http://eosweb.larc.nasa.gov/PRODOCS/misr/workshop/ppt/2010_lcluc/misr_tutorial.pdf
VIIRS is a multi wavelength imager, like MODIS with similar wavelength bands
VIIRS granule NASA MODIS Atmospheres SSEC PEATE VIIRS 0.67 – 0.55 – 0.49 µm 2 Sep 2012 20:24:27.8 UTC MODIS 0.66 – 0.55 – 0.47 µm 2 Sep 2012 21:40 UTC
VIIRS Nov 24, 2011 MODIS - AQUA Nov 24, 2011
VIIRS Level 2 & 3 Aerosol Data Level 2, VIIRS Data http://www.class.ngdc.noaa.gov/saa/products/search?sub_id=0&datatype_family=VIIRS&submit.x=26&submit.y=6 Level 3, Quarter Degree Gridded VIIRS Data http://www.star.nesdis.noaa.gov/smcd/emb/viirs_aerosol/products_gridded.php
References & links http://modis-atmos.gsfc.nasa.gov/mod04_l2/ . MISR DATA http://eosweb.larc.nasa.gov/PRODOCS/misr/Quality_Summaries/L2_AS_Products.html . OMI DATA http://disc.sci.gsfc.nasa.gov/Aura/data-holdings/OMI . IDEA http://www.star.nesdis.noaa.gov/smcd/spb/aq/ . SMOG BLOG http://alg.umbc.edu/usaq/ . ARSET-AQ webpage http://airquality.gsfc.nasa.gov/index.php?section=11 . MODIS ATMOS