Download
1 / 14
150 likes | 292 Views
Validation of TES Methane with HIPPO Observations. For Use in Adjoint Inverse Modeling. Kevin J. Wecht. TES Science Team Meeting. 17 June 2010. Special thanks to: Annmarie Eldering Daniel Jacob Steve Wofsy Susan Kulawik Lin Zhang Eric Kort

E N D
Validation of TES Methane with HIPPO Observations For Use in Adjoint Inverse Modeling Kevin J. Wecht TES Science Team Meeting 17 June 2010 Special thanks to: AnnmarieEldering Daniel Jacob Steve Wofsy Susan Kulawik Lin Zhang Eric Kort Greg Osterman Christopher Pickett-Heaps Vivienne Payne
TES Methane (Worden, Kulawik) HIPPO Methane (Wofsy, Kort) Validation Adjoint Inverse Modeling of Methane Sources GEOS-Chem CTM Apriori Sources • HIPPO Methane provides: • Large number of profiles • Wide latitudinal coverage • Remote from sources • (reduces collocation error) GEOS-ChemAdjoint Adjoint inverse analysis EDGAR v4, Kaplan, GFED 2, Yevich and Logan [2003] OPTIMIZATION OF SOURCES
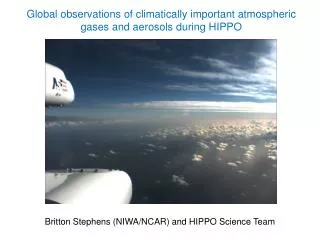
HIPPO HIAPER Pole-to-Pole Observation Program HIPPO II HIPPO I October 22 - November 20, 2009 January 9-30, 2009 147 vertical profiles 138 vertical profiles • Five missions: • Jan, Nov 2009 • April 2010, June & Aug 2011 • > 700 vertical profiles by finish • 80% surface – 330 hPa • 20% surface – < 200 hPa • Methane Instrument Properties • Frequency: 1 Hz • Accuracy/Precision: 1.0/0.6 ppb Photos courtesy: S. Wofsy Flight path Flight path Vertical Profile Vertical Profile
HIPPO w/ TES op. HIPPO 250-450 hPa HIPPO I Jan 9-30, 2009 TES HIPPO vs. TES by Latitude RTVMR [ppb] HIPPO II Oct 22 – Nov 20, 2009 RTVMR [ppb] TES observation operator is applied to all profiles unless explicitly stated. Positive bias and significant noise, but latitudinal gradient is captured.
TES over ocean TES over land HIPPO I Jan 9-30, 2009 Mean Bias HIPPO vs. TES by Latitude RTVMR [ppb] HIPPO II Oct 22 – Nov 20, 2009 RTVMR [ppb] HIPPO I: bias = 73.6 ppb, residual error = 41.1 ppb n = 129 HIPPO II: bias = 61.0 ppb, residual error = 44.8 ppb n = 147
Distribution of Residual Error • HIPPO I All Observations Histograms of HIPPO – TES difference mean = 73.6 σ = 41.1 n = 129 Mean and standard deviation in units [ppb] HIPPO II also shows Gaussian residual error. Ocean Observations Land Observations mean = 78.0 σ = 37.3 n = 90 mean = 63.7 σ = 47.8 n = 39 Errors are normally distributed, important for derivation of inversion cost function.
TES self-reported instrument error is ???-??? % ≈ ???-??? ppb TES bias and residual error vs. size of coincidence window Mean Bias Residual Error # Observations 24 hour Collocation Error 120 12 hour HIPPO I 80 [ppb] 40 Observation error 0 120 80 HIPPO II [ppb] 40 0 125 250 375 500 Distance [km] Distance [km] Distance [km] Quantify observation, representation error. Error and bias differ for HIPPO I and II.
TES and GEOS-Chem along HIPPO I flight track HIPPO w/ TES op. GEOS-Chemw/ TES op. HIPPO I Jan 9-30, 2009 Model Comparison TES RTVMR [ppb] TES and GEOS-Chem averaged over the Pacific during the HIPPO I period RTVMR [ppb] Consistency with HIPPO
TES and GEOS-Chem along HIPPO II flight track HIPPO w/ TES op. GEOS-Chemw/ TES op. HIPPO II Oct 22 – Nov 20, 2009 Model Comparison TES RTVMR [ppb] TES and GEOS-Chem averaged over the Pacific during the HIPPO II period RTVMR [ppb] Consistency with HIPPO
GEOS-Chem NOAA GMD [ppb] GEOS-Chem [ppb] Model Comparison – NOAA GMD2008 Annual Average NOAA GMD [ppb] [ppb] GEOS-Chem and GMD surface methane Latitude • GEOS-Chem provides good simulation in the annual average • Seasonality to inter-hem. gradient • Missing northern hemisphere sources? Natural gas production? [ppb] GEOS-Chem is a good platform inter-comparison of data sets such as TES methane.
GEOS-Chem GEOS-Chemw/ TES op. TES RTVMR [ppb] Model Comparison – TES2009 Annual Average GEOS-Chemw/ TES operator RTVMR Difference [ppb] • TES captures variability in GEOS-Chem, with large residual error. • Interpretation of latitudinal profile complicated by latitudinal structure of DOFS • Model overestimate around equator.
TES RTVMR w/ mean TES – GEOS-Chem difference subtracted GEOS-Chem GEOS-Chem RTVMR GEOS-Chemw/ TES op. TES Model Comparison TES a priori RTVMR Difference: GEOS-Chem – TES [ppb] Quantitative source attribution of differences requires inverse modeling. [ppb]
TES Methane (Kulawik, Osterman) HIPPO Methane (Wofsy, Kort) Validation Adjoint Inverse Modeling of Methane Sources GEOS-Chem CTM Apriori Sources • 4D-Var assimilation of TES data: • Optimize emissions on • 2x2.5 horizontal grid • monthly temporal res. • Evaluate results with HIPPO, NOAA GMD • Incorporation of additional satellite products GEOS-ChemAdjoint Adjoint inverse analysis EDGAR v4, Kaplan, GFED 2, Yevich and Logan [2003] OPTIMIZATION OF SOURCES
Thank You! • TES captures latitudinal gradient in HIPPO data • TES is biased high but residual instrument error is within self-reported range • 73.6 ± 41.1 ppb during HIPPO I • 61.0 ± 44.8 ppb during HIPPO II • Pending prognosis of TES instrument, will validate again with HIPPO IV & V • Enabling Inverse Modeling: • Time period: TES provides useful information through the end of HIPPO II. • Quantification of bias, observation error, and representation error. • Error normally distributed. • Robust latitudinal gradient with greater coverage than surface stations • HIPPO and NOAA GMD will be used to evaluate inversion results. • Future incorporation of additional satellite products.