Download
1 / 30
310 likes | 486 Views
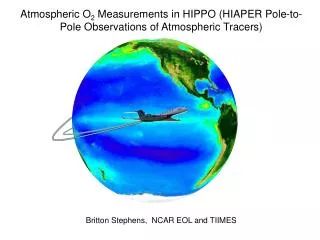
Atmospheric O 2 Measurements in HIPPO (HIAPER Pole-to-Pole Observations of Atmospheric Tracers). Britton Stephens, NCAR EOL and TIIMES. Careful atmospheric CO 2 measurements since the 1950s show that about half of fossil fuel emissions remain in the atmosphere. FF. Atm. [IPCC, 2007].

E N D
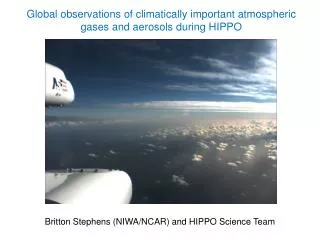
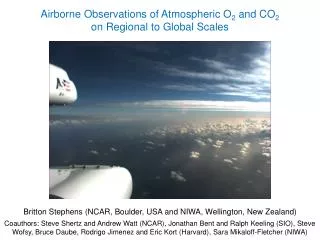
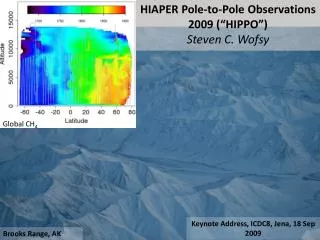
Atmospheric O2 Measurements in HIPPO (HIAPER Pole-to-Pole Observations of Atmospheric Tracers) Britton Stephens, NCAR EOL and TIIMES
Careful atmospheric CO2 measurements since the 1950s show that about half of fossil fuel emissions remain in the atmosphere FF Atm [IPCC, 2007]
Annual fluxes are small relative to balanced seasonal exchanges and to standing pools Annual residuals Pools and flows Net Oceanic Sink Land-Based Sink Uncertainties on natural annual-mean ocean and land fluxes are +/- 25 to 75 % The global carbon cycle for the 1990s, showing the main annual fluxes in GtC yr –1. [IPCC, 2007]
Global atmospheric inverse models and surface data have been used to make regional flux estimates Forward: Flux + Transport = [CO2] Inverse: [CO2] – Transport = Flux
Regional land flux uncertainties are very large • All model average and standard deviations: Northern Land = -2.4 ± 1.1 PgCyr-1 Tropical Land = +1.8 ± 1.7 PgCyr-1
Comparing the Observed and Modeled Gradients • 3 models that most closely reproduce the observed annual-mean vertical CO2 gradients (4, 5, and C): • Northern Land = • -1.5 ± 0.6 PgCyr-1 • Tropical Land = • +0.1 ± 0.8 PgCyr-1 • All model average: • Northern Land = • -2.4 ± 1.1 PgCyr-1 • Tropical Land = • +1.8 ± 1.7 PgCyr-1 Northern Land Tropical Land Most of the models overestimate the annual-mean vertical CO2 gradient Observed value
Airborne measurements suggest: • Northern forests, including U.S. and Europe, are taking up much less CO2 than previously thought • Intact tropical forests are strong carbon sinks and are playing a major role in offsetting carbon emissions [Stephens et al., Science, 2007] However, large (O ~ 2 PgCyr-1) flux uncertainties associated with modeling atmospheric CO2 transport remain
Transcom3 Fossil Fuel Response pressure N S N S N S N S ppm ppm latitude
TransCom Seasonal APO Amplitude T. Blaine, SIO Dissertation, 2005
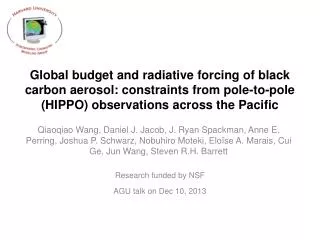
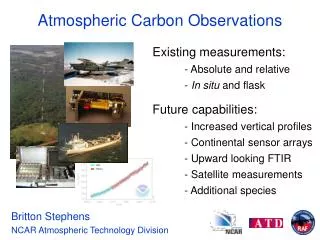
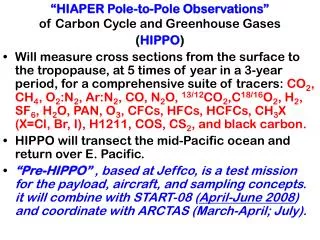
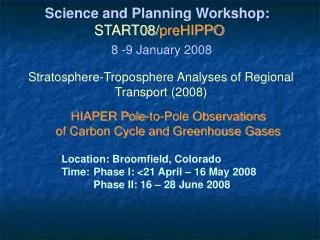
HIAPER Pole-to-Pole Observations of Atmospheric Tracers HIPPO (PIs: Harvard, NCAR, Scripps, and NOAA): A global and seasonal survey of CO2, O2, CH4, CO, N2O, H2, SF6, COS, CFCs, HCFCs, O3, H2O, and hydrocarbons
START-08/Pre-HIPPO Field Campaign 123 flight hours over six weeks in April/May and June of 2008 START08 PIs: Laura Pan (NCAR), Elliot Atlas (Miami U), Kenneth Bowman (TAMU) HIPPO PIs: Steve Wofsy (Harvard), Britt Stephens (NCAR), Jim Elkins (NOAA), Ralph Keeling (Scripps)
NCAR Airborne Oxygen Instrument (AO2) • measures O2 concentration (reported as O2/N2 ratio) using a vacuum-ultraviolet absorption technique • based on earlier shipboard and laboratory instruments, but designed specifically for airborne use to minimize motion and thermal sensitivity and with a pressure and flow controlled inlet system • switches between sample gas and air from a high-pressure reference cylinder every 2 seconds and has a precision of +/- 2 per meg on a 4-second measurement • consists of a pump module, a cylinder module, an instrument module, and a dewar
O2:CO2 ratios for Northern Hemisphere latitudinal gradients vary from -1.0 to -3.0
United States of America Oxidative Ratios for CO2 Sources Coal -1.17 ± 0.03 Liquid Fuel -1.44 ± 0.03 Expected ratio = -1.44 mol O2:mol CO2 Natural Gas -1.95 ± 0.04 Gas Flaring -1.98 ± 0.07 Cement Production 0.0 [R. Keeling, 1995] People’s Republic of China Mexico Expected ratio = -1.13 mol O2:mol CO2 Expected ratio = -1.46 mol O2:mol CO2 Atmospheric O2 measurements in urban pollution studiesBritton Stephens, NCAR ATD [from Marland, Boden, and Andres, http://cdiac.esd.ornl.gov]
O2:CO2 ratios for Northern Hemisphere temporal trends vary from -4.0 to 4.0
Fires and photosynthesis Initial climb out of Grand Forks, ND
Conclusions • Airborne O2 instrument is performing well and meaningful variations were observed from the surface to the stratosphere • Data analysis / paper writing is underway and minor modifications are being made in anticipation of HIPPO global in January ‘09