Non-renewable Resources
Non-renewable Resources. A resource is a natural substance that can be exploited for a profit. Resources whose natural replenishment rates are slower than their rates of exploitation are considered to be non-renewable.

Non-renewable Resources
E N D
Presentation Transcript
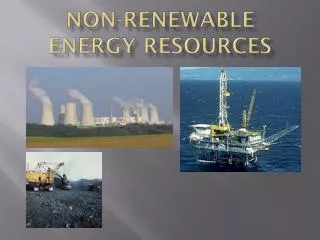
Non-renewable Resources • A resource is a natural substance that can be exploited for a profit. • Resources whose natural replenishment rates are slower than their rates of exploitation are considered to be non-renewable. • Minerals (ore deposits), coal, oil and gas are produced by geologic processes and thus are finite and cannot be replenished on human timescales. Naturally-occurring hydrocarbons are sourced from the burial of surface-derived organic matter.
When an item becomes a resource, the rate of production grows exponentially, passes through a peak and then precipitously declines until the resource is extinct.
Ever Increasing Domination of the Environment Human PopulationDateTime Required 1 billion 1850 all of human history 2 billion 1930 80 years 4 billion 1975 45 years 8 billion (projected) 2020 44 years Mackenzie (1998)
M. King Hubbert applied principles derived from mining geology concerning the life cycle of a non-renewable resource to petroleum geology and scaled the analysis up to a continent scale. Campbell & Lherrere (1998)
M.K. Hubbert, 1976, Bull. Assoc. Engr. Geol Foster Hewett’s, “Lifecycle of a Non-renewable Resource.” Chemical systems obey “Conservation of Mass.”
Hubbert (1977) 18 10 2 30 10 1 0.1 0.01 Rate (109 barrels/yr) Growth rate 7% Doubling time 10 yr 1880 1930 1980 1880 1930 1980 M. King Hubbert plotted world production figures (the rate versus the time) and demonstrated on a semilog plot a linear relationship. This implies exponential growth. The rate X time= amount. The area under the curve on the left is the amount. For a non-renewable resource the amount is finite.
Hubbert’s (1974) prediction as reproduced by the Economist The shape of the peak depends on the doubling time for consumption; the area under the curve must be the amount of the finite resource.
Increasing Q to 3200 X 109 only shifts the peak of production a decade or so.
Naturally-occurring hydrocarbons are sourced from the burial of surface-derived organic matter. Oil is essentially “canned” energy originally derived from the Sun.
Some Energy Terms • A barrel of oil upon combustion delivers about 6 gigajoules energy. • A joule/sec is a watt. • We use about 30 billion barrels of oil per year for an energy use of at a rate of 6 terawatts. • The Sun delivers approximately 1300 W/m2 compared to the geothermal output of ~60 milliwatts per meter square. • The Earth puts out about 30 terawatts. 30,000 gigajoules per sec from geothermal energy. Exploitation of energy to conquer our environment has enabled our species to flourish.
Campbell & Lherrere (1998) The time from the first commercial oil well (1859) to the peak of domestic U.S. production was only about 110 years. The “Age of Oil” will last ~200 years!
Campbell & Lherrere (1998) Disruptions to Oil Supply: Arab Oil Embargoes of 1973 &1979 Burning Kuwait Oil Fields (1st Gulf War)
The peak of US domestic production did not produce the catastrophy envisioned by some in 1970’s. Imports saved the day.
Largest Hydrocarbon Basins by Ultimate Potential
Global Giant Oil and Gas Fields Gas Oil
Arab Oil Embargoes In 1993, oil supplied about 30% or our energy needs. Peak of domestic production (~1970) and OPEC pricing drove recession and inflation.
Our dependence on oil did not decrease, our imports did! Realistically, fossil fuels will continue to dominate as an energy source for several more decades. Source: DOE/EIA
Estimates of 21st Century World Energy Supplies Petroleum Geoscientist Career Opportunities YEAR Edwards 2001
Campbell & Lherrere (1998) When global production and demand reaches 30 X 109 barrels/yr, watch out!
Global Exploration Opportunities for Future Growth N. Sea W. Siberia Sakhalin E. Canada Caspian Italy N Africa GOM Vietnam W. Africa Venezuela Malaysia Papua New Peru Indonesia Brazil Guinea Australia Argentina Wagner, 2005
What’s Next • When the peak of production is reached about half the oil is still in the ground. • At best, we have a few decades to figure out the transition away from oil. • We must understand the environmental consequences of our success. The 21st century will be the “Revenge of the Earth” era!