Download
1 / 5
50 likes | 172 Views
Discover how meteorologists measure and predict weather using advanced tools like satellites and radars. Learn why forecasts can't always be exact due to changing conditions.

E N D
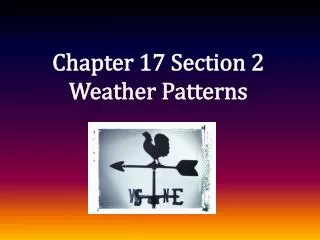
Chapter 17 Section 3 Weather Forecasts
1. What is a meteorologist? - a person who studies the weather 2. What do meteorologists measure? - temperature, air pressure, winds, humidity, and precipitation 3. What tools are used to gather data? - computer, weather satellites, Doppler radar, and instruments attached to weather balloons 4. How do meteorologists make forecasts? - use data from weather instruments to make weather maps, then forecasts
5. Why can’t meteorologists predict the weather exactly? - because conditions can change rapidly 6. What 2 sources does the National Weather Service depend on? • data collected from the upper atmosphere • data collected on Earth’s surface 7. What is a station model? -- shows the weather conditions at a specific location on Earth’s surface - a map meteorologists use to record information using symbols
- a line that connects points of equal temperature on a weather map 8. What is an isotherm? 9. What is an isobar? • a line drawn to connect points of equal atmospheric pressure on a weather map • indicate the locations of high- and low-pressure areas 10. How can you tell how fast winds are blowing? • look at how closely isobars are spaced • close isobars= large pressure difference over a small area= strong winds • spread apart isobars= small pressure difference= gentle winds
11. How are pressure areas drawn on weather maps? - circle with the word High or Low in the middle 12. How are fronts drawn? • as lines and symbols • triangles or semicircles point in the direction the front is moving 13. How do weather fronts move? - from east to west