Download
1 / 16
160 likes | 247 Views
Explore density fluctuation diagnostic in Wendelstein 7-AS, a stellarator fusion machine having unique features and external heating systems. Learn about plasma turbulence measurements using laser scattering.

E N D
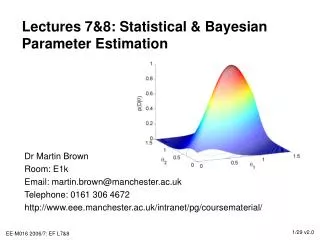
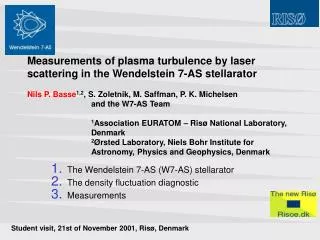
Measurements of plasma turbulence by laser scattering in the Wendelstein 7-AS stellaratorNils P. Basse1,2, S. Zoletnik, M. Saffman, P. K. Michelsen and the W7-AS Team1Association EURATOM – Risø National Laboratory, Denmark2Ørsted Laboratory, Niels Bohr Institute for Astronomy, Physics and Geophysics, Denmark The Wendelstein 7-AS (W7-AS) stellarator The density fluctuation diagnostic Measurements Student visit, 21st of November 2001, Risø, Denmark
Wendelstein Situated in Bayern, height 1838 m
The W7-AS stellarator • The ’stellarator’ was invented by Lyman Spitzer, Jr., in 1951 • A fusion machine has 3 main parts: • The vacuum vessel containing the plasma • A system of coils (W7-AS: 45 modular coils, 10 planar coils) creating the magnetic field required • External heating systems
The W7-AS stellarator • Machine size: Major radius R = 2 m, minor radius a 0.18 m • Rotational transform = n/m = poloidal/toroidal winding number is between 0.3 and 0.6 (safety factor q = 1/) • Maximum temperatures: Te = 7 keV, Ti = 2 keV • Maximum density: ne = 4 1020 m-3 • Maximum normalised plasma pressure: = p/(B2/20) = 3.1 % (average value)
The W7-AS flux surfaces • To visualise the magnetic field structure as a function of the toroidal angle , one can calculate flux surfaces on which the magnetic field and plasma current wind helically (shown here for = 0.344) • External heating systems: • Electron cyclotron resonance (ECR) heating: Gyrotrons at 70 and 140 GHz, total power 2.5 MW • Neutral beam injection (NBI) heating: 4 MW
The density fluctuation diagnostic • Diagnostic installed on the W7-AS stellarator • Small angle collective scattering of infrared light (radiation source is a CO2 laser) • Heterodyne, dual volume system (only 1 volume shown for clarity) • Wavenumber range is from 14 to 62 cm-1 • M. Saffman et al., Rev. Sci. Instrum. 72 (2001) 2579
The density fluctuation diagnostic • Diagnostic installed on the W7-AS stellarator • Small angle collective scattering of infrared light (radiation source is a CO2 laser) • Heterodyne, dual volume system (only 1 volume shown for clarity) • Wavenumber range is from 14 to 62 cm-1 • M. Saffman et al., Rev. Sci. Instrum. 72 (2001) 2579
Current ramp experiments A net plasma current can be created using an Ohmic (OH) external transformer The current alters the rotational transform The plasma confinement quality depends sensitively on Electron temperature Plasma energy versus and the vertical magnetic field Bz
The ultra high density mode Right: Autopower spectrum versus frequency and time, bad confinement Left: Autopower spectrum versus frequency and time, good confinement
The ultra high density mode Good confinement: Dotted line Bad confinement: Solid line
The ultra high density mode • Top rows: • Left: Autopower integrated over all frequencies [-3,3] MHz versus shot number • Right: Autopower integrated over [-3,-1.2] MHz versus shot number • Bottom rows (identical): • Stored energy versus shot number
Low- and high confinement mode Right-hand figure: Autopower spectra from a W7-AS shot displaying three distinct phases: • L-mode 100-400 ms • Dithering H-mode 400-550 ms • ELM-free H-mode 550-600 ms Left-hand figure: Autopower spectra from a DIII-D discharge. C. L. Rettig et al., Phys. Plasmas 4 (1997) 4009