Introduction to GIS
550 likes | 853 Views
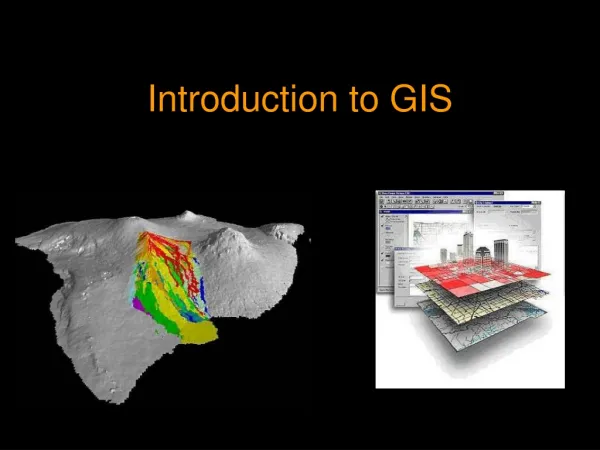
Introduction to GIS. Introduction. How to answer geographical questions such as follows: What is the population of a particular city? What are the characteristics of the soils in a particular land parcel?

Introduction to GIS
E N D
Presentation Transcript
Introduction How to answer geographical questions such as follows: • What is the population of a particular city? • What are the characteristics of the soils in a particular land parcel? • Are there any trends of earthquake in a particular zone which could help predict future quakes? • How has the distribution of rural and urban population changed between the past two censuses? • To answer such questions, proper and accurate data are required from different sources and these data should be integrated into consistent forms.
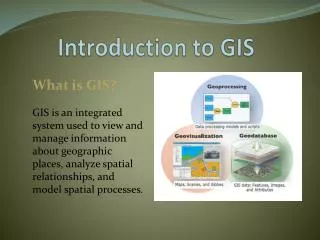
Definition A Geographical Information System (GIS) is a computer system for capturing, storing, querying, analyzing and displaying geographic data. Like any other information technology, GIS can be divided into the following four components: • Computer System includes computer and operating system to run GIS. Additional equipments may include: monitors for display, digitizer and scanner for spatial data input, and printers and plotters for hardcopy data display. • GIS Software • Brainware refers to the purpose and objectives, and provides the reason and justification for using GIS. • Infrastructure refers to the necessary physical, organizational, administrative, and cultural environments for GIS operations. Infrastructure includes requisite skills, data standards, data clearinghouse, and general organizational pattern.
Geographically Referenced Data • The ability of GIS to handle and process geographically referenced datadistinguishes GIS from other information system. • Geographically referenced data describe both location and characteristics of spatial features on the Earth’s surface. For example in describing a road, we need to refer its: • location (real world coordinate) • characteristics (road classification, its volume etc.) • GIS therefore handles two geographic data components: • Spatial Data relates to the geometry of spatial feature • Attribute Data give the descriptive information about the spatial features
Spatial Data Spatial features are two types • Discrete Features • These features don’t exist between observations • Form separate entities • Individually distinguishable • Example: Wells, roads, land use types etc. • Continuous Features • Exists spatially between observations • Example: Precipitation, elevation etc.
Spatial Data Data Model GIS uses two basic data models to represent spatial features: a) Vector Data Model • Uses points and their x-, y-coordinates to construct spatial features of points, lines, and areas. • Used to represent discrete objects over the space b) Raster Data Model • Uses a grid to represent the spatial variation of a feature. • Each cell in the grid has a value that corresponds to the characteristics of the spatial feature at that location • Well suited to represent continuous features like precipitation, elevation, temperatures etc. The Data Model determines how the data are structured, stored, processed, analyzed in a GIS
Vector and Raster DataModel Raster Vector Example: Vegetation Example: Elevation
Geographic features are represented by points, lines, and polygons • Points, lines and polygons are defined by a set or sets of x,y coordinates Vector Data
Feature types • Line • A series of connecting vertices • Has length but no area Vector Data
Raster Data Model • Spatial data are stored in a two dimensional matrix, much like a checkerboard • Each raster, or cell, contains a value Raster:
Classification of Spatial Data Data Model Spatial Data Vector Data Raster Data Non-topological Data Topological Data Simple Data Higher-level Data TIN Regions Dynamic Segmentation
Spatial Data Data Model Topology • Expresses explicitly the spatial relationship between features such as two lines meeting perfectly at a point and a directed line having explicit left and right side. • Necessary in for map overlay operations and network analysis. Simple Vector Data • Consists of point, line and polygon
Spatial Data Data Model Higher-level Vector Data • Built upon simple points, lines & polygons • Triangulated Irregular Network (TIN) approximates terrain with a set of non-overlapping triangles. Each triangle consists of points and edges that these points to form triangles Region collection of polygons, which may or may not be connected. Regions may overlap with one another or form a nested shape. Dynamic Segmentation built upon lines of a network and allows the use of real-world coordinate with linear measures such as mileposts.
Attribute Data • Attribute data describe the characteristics of spatial features • Amount of attribute data to be attached to a spatial feature can vary significantly depending on the feature type and application Attribute data and spatial data are often stored in separate file system. Spatial data are stored in graphics file. Attribute data are stored in relational database.
Relational Database A collection of tables, which can be connected to each other by attributes whose values can uniquely identify a record in a table
Relational Database Spatial data and attribute data in a GIS are typically linked through the feature ID.
Relational Database • Relational Db can be used for data search, data retrieval, data editing, and creation of tabular reports. • Relational Db has two distinctive advantages in GIS applications: • Each table in the Db can be prepared, maintained, and edited separately from other tables • The tables can remain separate until a query or an analysis requires attribute data different tables be linked together.
GIS Operations • Spatial Data Input • Attribute Data Management • Data Display • Data Exploration • Data analysis • GIS Modeling
Spatial Data Input Activities include: • Data Entry: a) Use Existing Data, b) Create New Data • Data Editing • Projection and re-projection • Geometric Transformation
Spatial Data Input: Data Entry • Most expensive part of a GIS project is a database (Db) construction • Two option for Db construction: • Use existing data • Create new data from: • Satellite images: a variety of maps such as land use, land cover etc. can be derived from processing satellite images • GPS data: can be used to determine location and shape of spatial features on the earth surface • Paper map: by digitizing and scanning
Spatial Data Input: Data Editing • Data editing is done to remove error occurred during digitizing • Digitizing error example: • Location accuracy of spatial data such as missing line or distorted line • Topological error
Spatial Data Input: Geometric Transformation • A newly digitized map has the same measurement unit (e.g. cm) as the source map used in digitizing or scanning. This digitized map must be converted to real-world coordinates by using a set of control points and with known real-world coordinate and a process called geometric transformation.
Attribute Data Management Activities include: • Data entry and verification • Database management To complete database construction for a GIS project, attribute data must be entered, verified, and managed. Two basic elements in the design of a relational database: • Key • type of data relationship: one-to-one, one-to-many, many-to-one
Data Display Data display through: • Map: Important for visualization and query. Maps are also plotted to show results of GIS analysis. Map Elements: Title, sub-title, body, legend, north arrow, scale, border. Map design is a creative process • Tables • Charts
GIS Operation: Data Exploration • Data exploration is data-centered query and analysis. • The purpose of data exploration is to better understand the data and to help formulate research question and hypotheses. • Data query allows the user to: • explore the general trends in the data • Take a closer look at data subsets • Focus on possible relationship between datasets • Effective data exploration consists of interactive and dynamically linked visual tools, including maps, graphs, and tables.
GIS Operation: Data Analysis • Data analysis in GIS is closely related to the data model (vector data model and raster data model) • Each data model has its own set of analytical functions • Common Functions: • For Vector data model: • Buffering • Map overlay • Distance measurement • Map manipulation • For Raster Data Model: • Map overlay, buffering etc. • Raster data analysis can be conducted at the level of individual cells, (local level) or group of cells (neighborhood or zonal), or cells within entire grid (global).
GIS Operation: Data Analysis • Spatial Interpolation: • describes the process of using control points with a known value to estimate values at other points. • applied to raster data • means of converting point data to surface data • Integrates vector and raster data • Spatial Interpolation methods: • Global: uses every control points available within the grid. Global Methods: a) Trend surface analysis, b) Regression Modeling • Local: uses a sample of control points. Local Methods: a) Kriging, b) Inverse distance weighted (IDW), c) Density estimation etc. • Network: a connected line coverage with the appropriate attributes for the flow of objects such as traffic. Example of network analysis: Shortest path analysis (minimum cost in time or distance between points in a network)
GIS Operation: Data Modeling • A model is a simplified representation of a phenomenon or a system • GIS modeling refers to the use of GIS in building analytical models with spatial data • Example of GIS operation for modeling is Map Overlay • Map Overlay: • Combines spatial and attribute data of different spatial features into a composite map. • Since each map feature on the composite map represents a selected set of data characteristics by location, the composite map can be further process to extract new information for modeling purpose. • Types of GIS models: • a) Binary, b) Index, c) Regression, d) Process