Download
1 / 60
690 likes | 795 Views
Explore the integration of GIS in connecting hydrology and meteorology data, spatial representation, terrain analysis using DEM, and map projections.

E N D
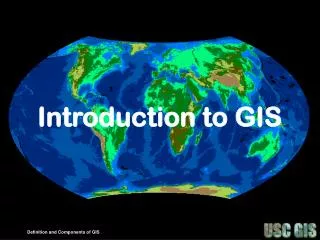
Introduction to GIS David R. Maidment Center for Research in Water Resources University of Texas at Austin http://www.ce.utexas.edu/prof/maidment
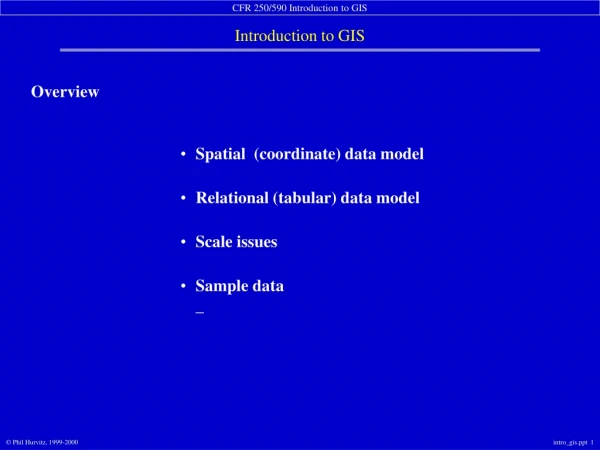
Presentation Outline • Using GIS to connect hydrology and meteorology • Representation of spatial objects in GIS • Terrain analysis using Digital Elevation Models • Geodesy and map projections
Hydrologic Cycle: Connecting the Land Surface with the Atmosphere
Connecting Hydrology and Meteorology • Two Spatial Scales • Drainage basin scale for consideration of severe storms and flood (Nexrad radar precipation as input, flood runoff as output) • Regional or global scale for consideration of climate change (Global climate models as input, time series of river flows as output)
Regional flood analysis in Houston Study region
Global Runoff (mm/yr) According to NCAR’s CCM3.2 Global Climate Model (GCM)
GTOPO30 - 30” Digital Elevation Model of the Earth Source: http://edcwww.cr.usgs.gov/landdaac/gtopo30/gtopo30.html
Drainage in North America Source: http://edcwww.cr.usgs.gov/landdaac/gtopo30/hydro/namerica.html
Drainage Basins of North America Source: http://edcwww.cr.usgs.gov/landdaac/gtopo30/hydro/na_basins.html
Amazon River MacKenzie River Congo River Yangtze River Streamflow Hydrographs for Large Basins Runoff Input from Climate Model Streamflow Output at River Mouth
A Fundamental Dilemma • Land Surface Hydrology has: • drainage patterns organized by rivers and watersheds which are spatially discrete • analysis in Cartesian coordinates (x,y,z) • Atmospheric Science has: • circulation patterns which are spatially continuous over the earth • analysis in Geographic coordinates (f, l, z) GIS can be used to connect these two spatial frameworks
Presentation Outline • Using GIS to connect hydrology and meteorology • Representation of spatial objects in GIS • Terrain analysis using Digital Elevation Models • Geodesy and map projections
Discrete and Continuous Space Discrete Space: Vector GIS Continuous Space: Raster GIS
Geospatial Database: a set of compatible data layers or themes
Spatial Data: Vectorformat Vector data are defined spatially: (x1,y1) Point - a pair of x and y coordinates vertex Line - a sequence of points Node Polygon - a closed set of lines
Feature Attribute Table Fields Records
Relational Linkages Spatial Attributes Water Right Locations Descriptive Attributes
Locations on the Stream Network Digital Stream Network Connects Control Point Locations
Spatial Data: Rasterformat Cell size Number of rows NODATA cell (X,Y) Number of Columns Definition of a Grid in GIS
Raster Vector Real World Raster-Vector Data Model
Presentation Outline • Using GIS to connect hydrology and meteorology • Representation of spatial objects in GIS • Terrain analysis using Digital Elevation Models • Geodesy and map projections
Study Region in West Austin Hog Pen Ck 4 km 4 km
Watershed Delineation by Hand Digitizing Watershed divide Outlet Drainage direction
DEM Elevations 720 720 Contours 740 720 700 680 740 720 700 680
DEM Elevations Contours 700 680
32 64 128 16 1 8 4 2 Eight Direction Pour Point Model
67 56 49 53 44 37 58 55 22 Direction of Steepest Descent 1 1 67 56 49 53 44 37 58 55 22 Slope:
2 2 4 4 8 1 2 4 8 4 128 1 2 4 8 2 1 4 4 4 1 1 1 2 16 Flow Direction Grid
Austin West 30 Meter DEMElevations in meters ftp://ftp.tnris.state.tx.us/tnris/demA.html
32 64 128 16 1 8 4 2 Flow Direction Grid
Flow Accumulation Grid 0 0 0 0 0 0 0 0 0 0 0 3 2 2 0 3 2 0 0 2 0 0 1 0 0 11 0 1 0 11 0 0 0 1 15 0 0 1 0 15 1 0 2 5 24 2 5 0 1 24 Link to Grid calculator
0 0 0 0 0 0 3 2 2 0 0 1 0 0 11 0 0 0 1 15 1 0 2 5 24 Flow Accumulation > 5 Cell Threshold
Stream Network for 5 cell Threshold Drainage Area 0 0 0 0 0 3 2 0 0 2 0 0 1 0 11 0 0 1 0 15 2 5 0 1 24
Streams with 200 cell Threshold(>18 hectares or 13.5 acres drainage area)
Watershed andDrainage PathsDelineated from 30m DEM Automated method is more consistent than hand delineation
DEM Data Sources • 30m DEMs from 1:24,000 scale maps (urban watersheds) • 3" (100m) DEMs from 1:250,000 scale maps (rural watersheds) • 15" (500m) DEM for the US resampled from 3” DEM (large drainage basins) • 30" (1km) DEM of the earth (GTOPO30)
Presentation Outline • Using GIS to connect hydrology and meteorology • Representation of spatial objects in GIS • Terrain analysis using Digital Elevation Models • Geodesy and map projections
Shape of the Earth It is actually a spheroid, slightly larger in radius at the equator than at the poles We think of the earth as a sphere
Geographic Coordinates (f, l, z) • Latitude (f) and Longitude (l) defined using an ellipsoid, an ellipse rotated about an axis • Elevation (z) defined using geoid, a surface of constant gravitational potential • Earth datums define standard values of the ellipsoid and geoid