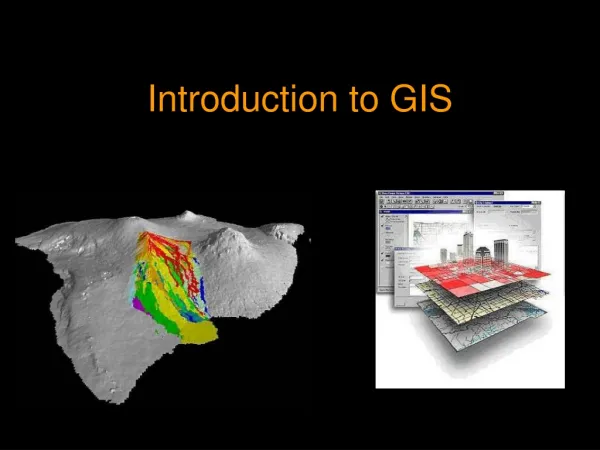
Introduction to GIS
530 likes | 748 Views
A Geographic Information System (GIS) is a powerful computer system designed to capture, store, analyze, and display geographically referenced information. GIS integrates hardware, software, and data, enabling users to visualize and interpret spatial data. From mapping to data analysis, it helps answer complex questions and solve real-world problems. By exploring spatial relationships through maps and charts, GIS uncovers patterns and trends. It supports various data models, including vector and raster formats, and allows for data integration, analysis, and sharing, making it vital across numerous industries.

Introduction to GIS
E N D
Presentation Transcript
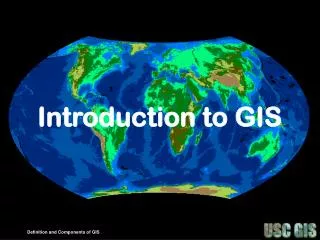
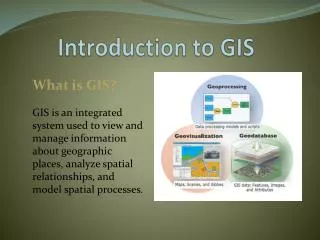
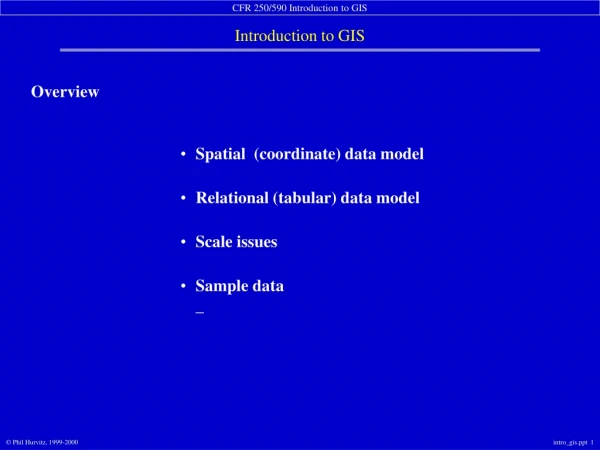
What is a GIS? A GIS is a computer system capable of capturing, storing, analyzing, and displaying geographically referenced information; that is, data identified according to location. Practitioners also define a GIS as including the procedures, operating personnel, and spatial data that go into the system. From USGS
What is GIS? (from ESRI) A geographic information system (GIS) integrates hardware, software, and data for capturing, managing, analyzing, and displaying all forms of geographically referenced information. GIS allows us to view, understand, question, interpret, and visualize data in many ways that reveal relationships, patterns, and trends in the form of maps, globes, reports, and charts. A GIS helps you answer questions and solve problems by looking at your data in a way that is quickly understood and easily shared. GIS technology can be integrated into any enterprise information system framework.
Data capture How can a GIS use the information in a map? If the data to be used are not already in digital form, that is, in a form the computer can recognize, various techniques can capture the information. Maps can be digitized by hand-tracing with a computer mouse on the screen or on a digitizing tablet to collect the coordinates of features. Electronic scanners can also convert maps to digits. Coordinates from Global Positioning System (GPS) receivers can also be uploaded into a GIS.
Locations (representations of geographic reality) • Absolute geographic or projected coordinates • Relative to another object • Attributes – database about each location • GIGO • Spatial Relationships • Geometric characteristics of individual objects • Length, area, perimeter, shape • Between 2 or more objects • Distance, Direction, Topology (adjacent or neighboring features) • How objects are distributed in space Geographic Information
Vector Data Point Features +2 +3 +4 +1
Vector Data Line Features Vector of coordinate pairs
Vector Data Area (Polygon) Features Vector of coordinate pairs that start and end with the same coordinate pair
Points • Trees • Sample plots • etc • Lines and Polylines • Streams • Roads • etc • Polygons • Boundary • Soil types • etc Vector data Database associated with all data (vector and raster) includes attributes about these points, lines and polygons or grid points. What types of attributes can you imagine?
Raster versus Vector DISCUSSION POINTS Scaling/pixelation Stair step effect Data size/complexity Uniform cell grid representing proportional ground area Points, lines, or polygonal areas
Raster – The Storage Space/Resolution Tradeoff Low Spatial Resolution to high Decreasing the Cell Size by one-half causes a Four-fold increase in the storage space required
Characteristics Can be Precise Defined by cell size Positional Precision Attribute Precision Poor for continuous data Good for continuous data Analytical Capabilities Good for spatial query, adjacency, area, shape analyses. Poor for continuous data. Slower overlays. Spatial query more difficult, good for local neighborhoods, continuous variable modeling. Rapid overlays. Data Structures Storage Requirements Often complex Often quite simple Coordinate conversion Network Analyses Relatively small Often quite large Output Quality Usually well-supported Often difficult, slow Easily handled Often difficult Very good, map like Fair to poor - aliasing Comparisons, raster v.s. vector Vector Raster
Vector-Raster Conversions Effects of Resolution on Grid representation of Polygon data
Vector-Raster Conversions Grid representation of Point data
Vector-Raster Conversions Grid representation of Line data
Data Capture • Store attributes in database • Edit shapes or attributes • Analysis (visualizing and combining geographic data to derive new information) • Queries (attribute, location) • Geoprocessing (any GIS operation that creates new data) • Data extraction (creating a subset of features from 1 data set based on the geographic extent of another) CLIP • Overlays (combining 2 or more data sets to create a new one) INTERSECT • Proximity (finding areas that are near features) BUFFER • Display • Output GIS Operations
Different degrees of complexity depending on results needed. Popularity exploding thus new software emerging constantly. Money to be made. GIS Software
Commercial Desktop GIS • MapGuide by Autodesk • IGIS by ScanPoint • MicroStation by Bentley Systems • Intergraph • MapInfo by Pitney Bowes • Smallworld by GE • RegioGraph by GfKGeoMarketing • ThinkGeo • GMS by Aquaveo • SIS by Cadcorp • Maptitude by Caliper • Dragon/ips • ENVI • Field-Map • Manifold System • Netcad
Google Earth • Basically a pre-populated free GIS • Layers of Google’s choice • Can measure • Can create tour • Some historic maps • Artificial shadows • Flyover
Google Earth – limited but free GRASS – US Army Corps of Engineers (Free) IMAGINE by ERDAS IDRISI by Clark Labs Manifold – state of the art but not free Quantum – Used in Africa, Asia (Free) Xmap 8 – Easy and inexpensive Other GIS Programs of note
The Geodatabase View GIS dataset – geographic representation Vector data: Points, Lines, Polygons
The Geodatabase View GIS dataset – geographic representation Raster (grid cell) data or images
The Geodatabase View GIS dataset – geographic representation (Networks) In this network example, street features represent edges that connect at their endpoints (junctions) and are used to model the movement from one edge to another.
The Geodatabase View GIS dataset – geographic representation Terrains and other surfaces
The Geodatabase View GIS dataset – geographic representation Survey measurements
The Geodatabase View GIS dataset – geographic representation Other data types, such as addresses, place names…
The Geodatabase View GIS dataset – descriptive attributes
Topology is employed to manage common boundaries between features, define and enforce data integrity rules, and support topological queries and navigation—for example, to determine feature adjacency and connectivity. Topology is also used to support sophisticated editing and to construct features from unstructured geometry—for example, to construct polygons from lines. THE GEODATABASE VIEW Geographic features share geometry. Feature geometry can be described using relationships between nodes, edges, and faces.
Spatial data representation (Map layers…) Non-spatial data representation (Attribute tables…) Spatial vs. Non-Spatial Representations
The connection between spatial and non-spatial data are made through database tables Spatial vs. Non-Spatial Data
Spatial vs. Non-spatial Queries • Spatial queries: require a spatial analysis (e.g. proximity, distance, intersection…) • Non-spatial queries: are database lookup operations (e.g. locate all hemlock forest cover types…) Both types of queries will produce a map!
Spatial vs. Non-spatial Queries State adjacent to Kentucky State = Kentucky
The Geovisualization View Temporal views used to track hurricanes
DATA + TOOL = NEW DATA Geoprocessing / Analysis