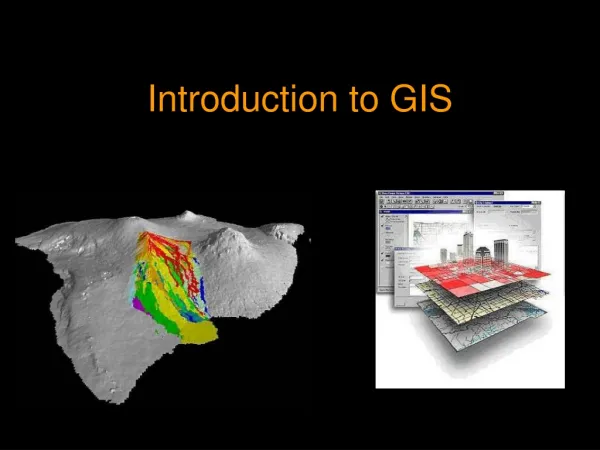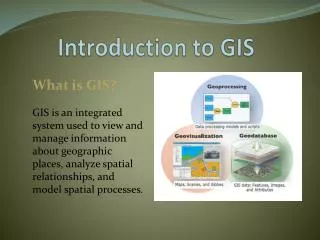
Introduction to GIS
Introduction to GIS. Lecture Outline. What is GIS? Evolution of GIS Elements of A GIS The scope of GIS Data Structures. G. I. S. eographic nformationystem. GEO GRAPHIC. GEO - physical aspects - socio-demographic aspects - artificial aspects

Introduction to GIS
E N D
Presentation Transcript
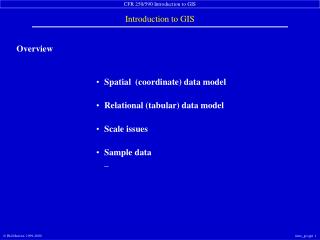
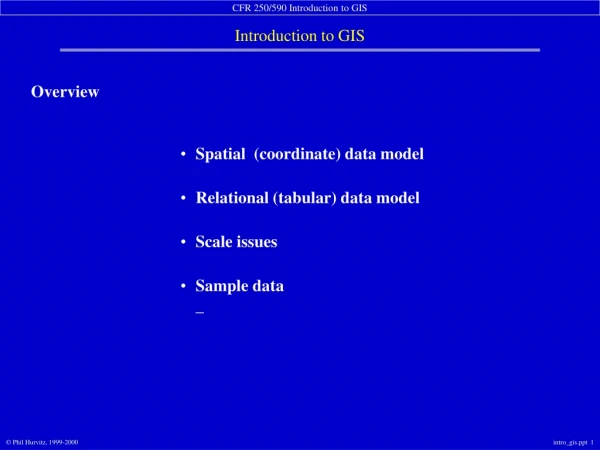
Lecture Outline • What is GIS? • Evolution of GIS • Elements of A GIS • The scope of GIS • Data Structures
G I S eographic nformationystem
GEOGRAPHIC • GEO - physical aspects - socio-demographic aspects - artificial aspects *all with fixed locations (coordinates)
GEOGRAPHIC • GRAPHIC - does not refer to graphic representations like maps - refers to description of the earth and what is upon it - described in a digital model (3D) which allows visualization at any possible point of view - presentation of processed data in the form of one or more maps
INFORMATION • "communication of knowledge" • a GIS provides information • by itself, a GIS does not contain information • a GIS makes information - by processing data already entered
SYSTEM • Regularly interacting group of items forming a unified whole.
GIS A computer system for capturing, managing, integrating, manipulating, analyzing and displaying data spatially referenced. -Donnell & Kemp, 1995
EVOLUTION OF A GIS -evolved from different fields in which development has led to the GIS as we now know it. • cartography (high quality drafting) • CAD / computer graphics • surveying • remote sensing • computer technology (made it affordable)
Geographical data describes objects from the real world... • position w/ respect to a known coordinate system • their attributes (e.g. pH, color, cost, etc.) • their spatial interrelations w/ each other (topological relations), which describe how they are linked or how one can travel between them
Items in a GIS are classified into separate components…. • degree of hardness or tangibility • position in the data flow
According to Hardness or Tangibility • hardware • software • orgware
HARDWARE • micro pc - at least a 486DX with minimum 16 megabytes ram, 1 GB hard disk with color monitor (at least 256 colors) • scanner and /or digitizer • inkjet printer and/or plotter • any large data storage device
IDRISI ILWIS ARCVIEW PC ARCINFO MAPINFO OZ-GIS ER MAPPER GRASS ATLAS SOFTWARE
ORGWARE • organization about the use of hardware and software • man, their methods and organization • “education and training” of staff at all levels
According toPOSITION IN DATA FLOW • input • storage /management • processing, manipulation and analysis • output
DATA…DATA…DATA • valid output needs a valid input - expensive • collect only needed data but due to expense in collection, the data should also be multipurpose, ie., it can still be used by unrelated independent users • data exchange - standards are needed • data quality - the potential error should be measurable
DATA COST vs DATA QUALITY DATA COST 0 100% 0% DATA QUALITY
3 components of geographic data • the phenomenon being reported (physical dimension or class) e.g., live coral cover, height of forest canopy, population of a settlement, width of a road • spatial component - represented on a map as either a point, line or area. • time - not stated explicitly, but often critical
DATA INPUT • involves also converting data (analog to digital) • typically the major bottleneck • GIGO, so checking for inaccuracies is very important • input methods and standards must be considered first before data entry
DATA MANAGEMENT • storing and retrieving data • method implemented affects the efficiency of the system • also involves organization of data - its structure and relationships determine how data is accessed and the speed of the retrieval
DATA ANALYSIS • determines the information that can be generated • introduction of a GIS will not only automate, it will also change the way an organization works
DATA OUTPUT • maps • tables • text
SCOPE OF GIS(a specific purpose) • spatial analysis • spatial planning • implementation of plans • spatial management
SPATIAL ANALYSIS • starts with a description of the situation at a given moment (point-in-time measurement which may not be sufficient particularly if the purpose is to gain insight as to how the situation develops in the future)
SPATIAL ANALYSIS(a “simplistic” case) • assume coral reef susceptibility to man-induced destruction is determined by: • availability of materials for blast fishing • population density of dynamite fishermen • it is the relationships between these factors that determines reef areas most susceptible to man-induced destruction
The Problem Find coral reef areas in Cebu that have the lowest potential for success in coral reef conservation.
What data do we need? • coral coverage - map of coral coverage (MAP 1) • availability of materials for blast fishing - map showing locations of large mango plantations (MAP 2) • density of dynamite fishermen - map showing population densities of dynamite fishers in coastal areas (MAP 3)
How do we analyze the data? • Map 1 - show areas with >50% live coral coverage • Map 2 - show coastal areas that are near a large mango plantation. • Map 3 - show coastal areas that have high population densities for bad fishermen
MAP 1 Areas with good coral reefs….
MAP 2 coastal areas near large mango plantations….
MAP 3 Areas with high densities of bad fishermen
The analysis produces…... • MAP 4 - intersection areas in all the 3 maps produced earlier will show the areas that are: • having coral coverages > 50% • near dynamite sources • near areas with high density of bad fishermen • these are unsuitable areas for reef reserves…
MAP 5 Areas unsuitable for reef reserves Areas suitable for reef reserves
SPATIAL PLANNING • as a result of the analysis one can judge whether an area is suitable (high possibility of success) for the establishment of a marine sanctuary or not……planning • the design of the plan also specifies where in the environment what interventions should occur - an outline of the future situation
IMPLEMENTATION OF THE PLANS • plans are executed • not anymore controlled by the GIS but can be monitored by it….. which leads us to the management aspect
SPATIAL MANAGEMENT • monitoring…. wherein changes are recorded and attention is paid that no major disturbances occur • degree of destruction is closely watched
DATA STRUCTURES • data always refers to a location on the surface of the earth expressed in a local or global co-ordinate system • data has to be digitally stored for a computer to be able to read it
WHERE & WHAT • description of the world can be done in geographical terms (where are the objects), • or in thematic expressions (what are the objects) *a meaningful description of the real world in its spatial manifestation always contains both.
content (what?) the meaning what it represents in reality convention (how?) the format how it is stored in the computer DISTINCTION BETWEENSEMANTICS AND SYNTAX
“Ich mag GIS” “Ganahan ko sa GIS” “Four added to five makes ten” “Fayb added to fayb makes ten”
RASTER or GRID & VECTOR 2 MAJOR DATA SYNTAXES
RASTER or GRID • a “grid” of a uniform pattern is put over area to be described • to each element a value is attributed • with a regular structure - position of each element can be defined in relation to the rest
VECTOR • structure points are recorded in co-ordinates and these are connected to lines (the vectors) • a number of vectors can be joined to form polygons (areas) • considers objects
3 object types • point - geometric description only refers to the position of the object by a pair of coordinates (x, y); used for trees, posts etc. • line - geometrically described by recording the coordinates of a series of points and the sequence in which these points should be linked (1D; eg., roads, canals, rivers) • polygon - a line with the same start and end, usually refers to an enclosed region (2D; eg., lakes, ponds, farm plots)
A Line in………………….. raster vector
row = 1 column = 1 data = 1 a raster line…….. row = 2 column = 1 data = 0 row = 3 column = 3 data = 1
direction length a vector line ……. start position (x1, y1) may also be a function end position (x2, y2)
RASTER vs VECTOR • larger • smaller • FILE SIZE • SPEED • LINKING DATA • ACCURACY • faster • slower • easier • A bit more difficult • ? • ?