Download
1 / 22
220 likes | 396 Views
Airborne Doppler lidar measurements of the ocean and river surface return Ch. Werner, J. Streicher, O.Reitebuch, E. Nagel DLR Institute of Atmospheric Physics T. Schneiderhan, T. König, S. Lehner DLR Remote Sensing A.Dabas Meteo France P. Delville INSU.

E N D
Airborne Doppler lidar measurements of the ocean and river surface return Ch. Werner, J. Streicher, O.Reitebuch, E. Nagel DLR Institute of Atmospheric Physics T. Schneiderhan, T. König, S. Lehner DLR Remote Sensing A.Dabas Meteo France P. Delville INSU
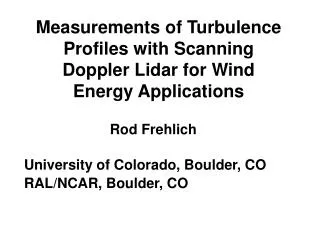
SAR grey scale for 42.721 N/6.664 E July 4th, 2001, 10.20 UTC
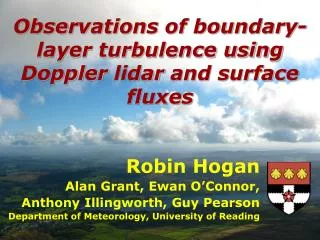
Wind speed along the flight track (surface layer)
WIND Instrument Single LOS versus VAD Ch. Werner, I. Smalikho, J. Streicher, O. Reitebuch DLR Institute of Atmospheric Physics A. Dabas Meteo France P. Delville INSU
Error of wind velocity estimate E versus the difference between the laser beam direction and true wind direction‘ = q- qv at U = 1 m/s (a); U = 10 m/s (b); U = 30 m/s; d = 5 deg (1);d= 10 deg (2); d = 20 deg; sLOS = 0.1 m/s (dashed curve) andsLOS = 1 m/s (solid curves)
Color plot of the LOS versus pulse number non-scanning (above) and VAD scan (below)
LOS component 177° (above) versus wind profile (below)
The estimated wind is about 6.5 m/s from 145 degree This gives about 3.4 m/s LOS for the Estimated 177 degree fixed LOS measurement It is proposed to perform a flight with 50 km LOS measurements and 150 km using VAD scans for an ADM data base
Proposed WIND flight for ADM LOS (50 km) and VAD (150 km) ERS-SAR or Envisat SAR track suggested
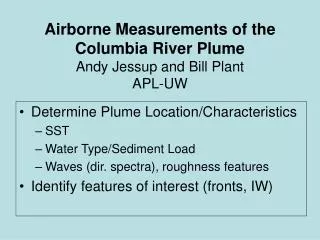
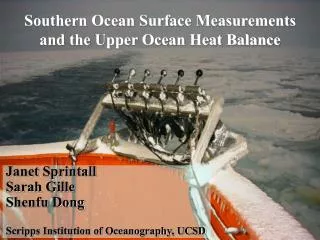
Map of the area around Marseille (France) and flight path for the Doppler lidar WIND with circles showing the laser ground position
Density plot of the hetorodyne signal, two positions of the cursor are selected for land return (a) and river return (b)
Two intensity profiles for the cursor positions a (land) and b (water) land river
Sensitive volume for a cw laser Doppler anemometer at 175 m focussed range from the platform (left) and mean signals (right) to explain the two wind contributions
Computer printout of the continuous recording of the LOS wind component (4 seconds) at a range of 175 m and water surface height (against the wind)