Download
1 / 19
190 likes | 229 Views
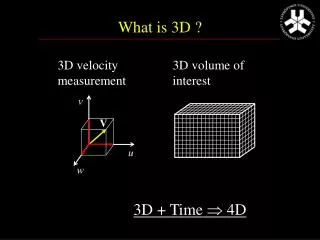
Explore NASA’s usage of coherent Doppler lidar to measure river surface velocity with precision and applications in hydrology and wind measurements. Learn about hardware, geometry constraints, deployment, and methods for optimal results.

E N D
Coherent Doppler Lidar Measurement of River Surface Velocity Michael J. Kavaya NASA/LaRC to Working Group on Space-Based Lidar Winds Oxnard, CA Feb. 7-9, 2001
Authors Steven C. Johnson, MSFC Thomas J. Papetti, UAH/CAO Philip A. Kromis, CSC Michael J. Kavaya, LaRC J. Rothermel, MSFC D. Bowdle UAH, F. Amzajerdian, UAH/CAO (soon LaRC) Acknowledgements Tim Miller, MSFC Dave Emmitt & Chris O’Handley, SWA P. Capizzo, Raytheon
Why Investigate Doppler Lidar Measurement Of Water Velocity? NASA’s Hydrological Cycle Program USGS Desire For New River Discharge Instrumentation Potential Of Ocean Returns To Aid Calibration Of Global Doppler Lidar Wind Measurement See: “NASA Post-2002 Land Surface Hydrology Mission Component for Surface Water Monitoring: HYDRA-SAT,” C. Vorosmarty et al, April 12-14, 1999. “First Meeting Report of the Working Group on Future Space-based Hydrology Missions,” Aug. 3-4, 2000
Lidar Hardware 2.02-Micron Tm:YAG Pulsed, 6 Hz 50 mJ, 400 ns, 10 cm Flashlamp pumped Procured from CTI (8/93) Loaned to and flown by Air Force/CTI on C-141 (6/95)
Field Deployments To Tennessee River Sheffield, AL bluff overlook (~ 50 m) Downstream from Wilson dam (~ 3 miles) Deployments: 12/17/99, 2/24/00, 11/14/00
Geometry Lidar Depression Angle Land Lidar Height Above Target Min. R Or Greater Normal Angle River
Constraints Range to water must be greater than minimum range of lidar Too large a depression angle will let lidar strike bluff and/or have insufficient range to water Too small a depression angle will cause a large normal angle Too large a normal angle will have very small water backscatter Too small a normal angle will not intercept much water velocity Desire a wind range gate before the water: hence even larger target ranges
Chronology 12/17/99, 2/24/00 deployments Depression angles from horizontal as large as 5 deg. Ambiguous data Engineering effort to reduce lidar minimum range to allow greater depression angles to raise water signal Minimum range successfully lowered from 350 m to 120 m 11/14/00: depression angles as large as 18 deg.
Methods for shortening minimum range • Backscatter reduction by optics surface quality improvement and various layout modifications: • Several such modifications were made, but orders of magnitude of backscatter reduction are necessary to significantly shorten minimum range, due to exponential nature of pulse tail • Pulse tail suppression (the method chosen): • Tail suppression produces a direct reduction of minimum range to the point at which the tail is suppressed without significant loss of outgoing pulse energy
Method of tail suppression Intra-resonator Acousto-Optic Loss Modulator (AOM) Convenient: AOM already existed in transmitter for Q-switching function Effective: Multiple passes through modulator during one pulse duration produce rapid and complete suppression
Transmitter Q-switch location Modulator moved 10 mm in this direction to reduce modulation delay Laser Oscillator Direction of acoustic propagation Lamps & Cr:Tm:YAG rod ¼-wave plate Output coupler PZT Etalon Output Brewster plate ¼-wave plate Q-switch AOM 50 MHz PZT R=100%
Power of spurious backscatter pulse Pulse with tail Pulse with tail suppressed 0.02 Power (normalized to peak) 0.01 0 - 1000 - 500 0 500 1000 1500 2000 - 1500 Time (ns)
Spurious backscatter pulse(97 MHz heterodyne IF) 0.10 Pulse with tail Pulse with tail suppressed 0.05 Voltage (normalized to peak) 0 0 0.05 Note significant tail 2 ms past peak 0.10 1500 1000 500 0 500 1000 1500 2000 j ns Time (ns) Time (ns)
Chronology (cont.) 12/17/99, 2/24/00 deployments Depression angles from horizontal as large as 5 deg. Ambiguous data Engineering effort to reduce lidar minimum range to allow greater depression angles to raise water signal Minimum range successfully lowered from 350 m to 120 m 11/14/00: depression angles as large as 18 deg. Better results but not definitive. Where water signal is noticeable, the velocity is near zero. Difficult to obtain air velocity range gate before water.
Example of a River Measurement? 7.4 m/s Signal Amplitude Away Velocity Possible River Return RF Switch Outgoing Pulse Return from Air Air Velocity River Surface? Toward Range Range 600 m Nov. 14, 2000; Run 6 20-pulse integration ~10o depression angle Upwind and downstream
Comments Water backscatter varies greatly with normal angle up to ?20? deg. Function will depend on water purity, waves, surface wind 400 km, 30 deg. space mission will hit ocean at 32 deg.; 833 km, 45 deg. space mission will hit ocean at 53 deg. Further reducing minimum range and/or flying lidar on aircraft will still have problem of near zero air and water velocities. Where can we find large air and water velocity? How does surface wind affect water velocity? Controllable water target (range, angle, flow, purity) may greatly help sort out effects. Plan to build. Plan further analytical study to define the effects of water spray above river surface, and river surface waves and ripples on signal amplitude and flow velocity estimate.