Standard Normal Distribution
Standard Normal Distribution. The Classic Bell-Shaped curve is symmetric, with mean = median = mode = midpoint. Standard Normal Distribution. Probabilities in the Normal Distribution. The distribution is symmetric, with a mean of zero and standard deviation of 1.


Standard Normal Distribution
E N D
Presentation Transcript
Standard Normal Distribution The Classic Bell-Shaped curve is symmetric, with mean = median = mode = midpoint
Probabilities in the Normal Distribution • The distribution is symmetric, with a mean of zero and standard deviation of 1. • The probability of a score between 0 and 1 is the same as the probability of a score between 0 and –1: both are .34. • Thus, in the Normal Distribution, the probability of a score falling within one standard deviation of the mean is .68.
More Probabilities • The area under the Normal Curve from 1 to 2 is the same as the area from –1 to –2: .135. • The area from 2 to infinity is .025, as is the area from –2 to negative infinity. • Therefore, the probability that a score falls within 2 standard deviations of the mean is .95.
Normal Distribution Problems • Suppose the SAT Verbal exam has a mean of 500 and a standard deviation of 100. • Joe wants to be accepted to a journalism program that requires that applicants score at or above the 84th percentile. In other words, Joe must be among the top 16% to be admitted. • What score does Joe need on the test?
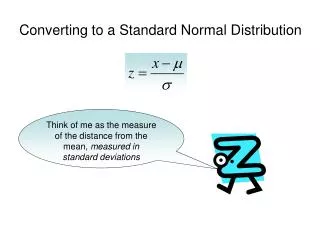
To solve these problems, start by drawing the standard normal distribution. Next, formula for z:
Now Check the Normal Areas • We now know that: • 2.5% score below 300; i.e., z = –2 • 16% score below 400 • 50% score below 500; i.e., z = 0 • 84% score below 600 • 97.5% score below 700; i.e., z = 2
Solution Summary • Joe had to be among the top 16% to be accepted. • That means his z-score must be +1. • Thus, his raw score must be at least 600, which is one standard deviation (100) above the mean (500). • Therefore, Joe needs to score at least 600.
Next Topic: Correlation • We have seen that the z-score transformation allows us to convert any normal distribution to a standard normal distribution. • The z-score formula is also useful for calculating the correlation coefficient, which measures how well one can predict from one variable to another, as you learn in the next lesson.