Download

1 / 11
120 likes | 397 Views
Finding Probabilities using the Standard Normal Distribution. Section 10.5. The standard normal distribution is the most commonly used distribution. It is a distribution of z- scores. Remember them?!. The Z Score.

E N D
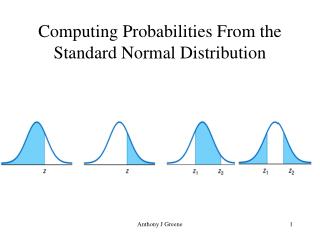
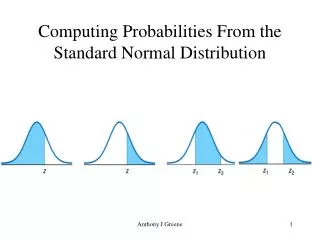
Finding Probabilities using the Standard Normal Distribution Section 10.5
The standard normal distribution is the most commonly used distribution. It is a distribution of z- scores. • Remember them?!
The Z Score • A z-score is a way to compare how an individual value relates to the rest of the data set. • Value minus the mean then divided by the standard deviation
Theorem (page 217) • The Standard Normal Curve (z distribution) is the distribution of normally distributed standard scores with mean equal to zero and a standard deviation of one. • Raw data – original score • Standardized data – the z-score
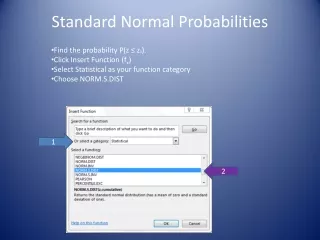
Instead of finding probabilities by hand for each z-score, mathematicians have created a table that easily finds the probability. Let’s explore how it works. • Turn to page 875 • This chart tells you the probability of every outcome occurring UP TO the given z- score. • To find the probability of an event greater than the z-score, you will need to do 1 – the number in the chart. • Be careful – z-charts are different depending on the book!!
What if your z-score is negative? • Your table only gives you positive z-scores • To find the area with a negative z-score: 1 – area of positive z-score • Example: z score z = -1.35 • Look up 1.35 ; .9115 • 1 - .9115= .0885
Example 1 • Find the probability that a randomly chosen observation from a standard normal distribution is less than .96 Z – score: .96 Chart: .8315 So 83.15%
Example 2 • Find the probability than an observation from a normally distributed random variable falls within the given range: • a. between 0 and .96 • B. greater than .96 • C. less than -.96 • D. Between -.96 and .96 area at .96 - .5 .8315 - .5 .3315 1 - area at .96 1 - .8315 .1685 1 - .8315 .1685 1 - area at .96 2(.3315) = .6630
Example 3 • If a set of data is normally distributed, what percent of the data is within 1.5 standard deviations of the mean (use your chart!) • Z-score: 1.5 • Chart: .9332 • .9332 - .5 = .4332 • .4332 *2 = .8664
Homework Pages 659 – 660 1 - 16