Download

1 / 17
170 likes | 403 Views
Standard Normal Distribution. The following frequency distribution represents the heights (in inches) of eighty randomly selected 5-year olds. Construct a relative frequency histogram Draw a normal density curve on relative frequency histogram. Construct a relative frequency histogram.

E N D
The following frequency distribution represents the heights (in inches) of eighty randomly selected 5-year olds.
Construct a relative frequency histogram • Draw a normal density curve on relative frequency histogram
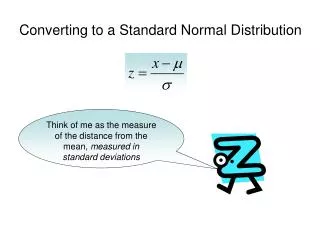
Question 1 • Find the area under the standard normal curve to the right of z= -0.46 • Solution: • Find the row that represents -0.4 and the column that represents 0.06. The area to the left of z=-0.46 is 0.3228 • The area to the right of -0.46=1-0.3228 0.6772
Question 2 • Find the area under the standard normal curve between z=-1.35 and z=2.01 • Solution: • Find the area to the left of z=2.01 • Find the area to the left of z=-1.35 • The area under the standard normal curve between z=2.01 and z=1.35 is: • (area to left of z=2.01)-(area to right of z=-1.35) • 0.9778-0.0885=0.8893
Question 3 • Find the z-score so that the area to the left of the z-score is 0.32 • Solution: • Look for area in the table closest to 0.32 • Find z-score that corresponds to the area closest to 0.32 • From table closest area of 0.32 is 0.3192 which corresponds to z-score of -0.47
Question 4 • Find the z-score so that the area to the right of the z-score is 0.4332 • Solution: • Find the area to the left of the unknown z-score • Area to the left=1-area to the right • 1-0.4332 • 0.5668 • From the table find an area closest to 0.5668 • Area closest to 0.5668 is 0.5675 • Corresponding z-score of 0.5668 is 0.17
Question 5 • Determine the area under the standard normal curve that lies to the right of: (a) z=-3.49 • Solution: • Area to the right=1-area to the left • Area to the left = 0.0002 • Area to the right =1-0.0002 • 0.9998
Determine the area under the standard normal curve that lies to the right of: (b) z=-0.55 • Solution: • Area to the right=1-area to the left • Area to the left = 0.2912 • Area to the right=1-0.2912 • 0.7088
Determine the area under the standard normal curve that lies to the right of: (c) z=-2.23 • Solution: • Area to the right=1-area to the left • Area to the left = 0.9871 • Area to the right =1-0.9871 • 0.0129
Determine the area under the standard normal curve that lies to the right of: (d) z=3.45 • Solution: • Area to the right=1-area to the left • Area to the left = 0.9997 • Area to the right =1-0.9997 • 0.0003
Question 6 • The mean incubation time of fertilized chicken eggs kept at 100.5 F in a still air incubator is 21 days. Suppose that the incubation times are approximately normally distributed with a standard deviation of 1 day. (a)What is the probability that a randomly selected chicken hatches in 20 days • Solution: • Z=(x-µ)/δ= 20-21/1=-1.00 • From table the area to the left of z=-1.00 is 0.1587
The mean incubation time of fertilized chicken eggs kept at 100.5 F in a still air incubator is 21 days. Suppose that the incubation times are approximately normally distributed with a standard deviation of 1 day. (b)What is the probability that a randomly selected chicken egg takes over 22 eggs to hatch • Solution: • Z=(x-µ)/δ= 22-21/1=1.00 • From table the area to the left of z=1.00 is 0.8413. • Area to left of z=1.00=1-0.8413=0.1587
The mean incubation time of fertilized chicken eggs kept at 100.5 F in a still air incubator is 21 days. Suppose that the incubation times are approximately normally distributed with a standard deviation of 1 day. (c)What is the probability that a randomly selected chicken egg hatches between 19 and 21 days • Solution: • =( -µ)/δ= 19-21/1=-2.00 • =( -µ)/δ=21-21/1=0 • From table the area to the left of =-2.00 is 0.0228. • Area to left of =0 is 0.5000 • P(19<x<21) = 0.5000-0.0228= 0.4772
CSTEM Web link http://www.cis.famu.edu/~cdellor/math/ • Presentation slides • Problems • Guidelines • Learning materials