
Chapter 10: Sampling and Sampling Distributions
E N D
Presentation Transcript
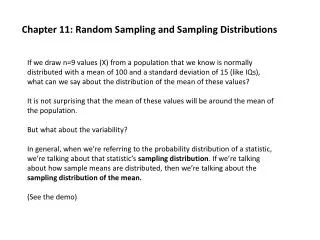
Chapter 10:Sampling and Sampling Distributions • Aims of Sampling • Basic Principles of Probability • Types of Random Samples • Sampling Distributions • Sampling Distribution of the Mean • Standard Error of the Mean • The Central Limit Theorem
Sampling • Population – A group that includes all the cases (individuals, objects, or groups) in which the researcher is interested. • Sample– A relatively small subset from a population.
Sampling • Parameter – A measure (for example, mean or standard deviation) used to describe a population distribution. • Statistic – A measure (for example, mean or standard deviation) used to describe a sample distribution.
Probability Sampling • Probability sampling – A method of sampling that enables the researcher to specify for each case in the population the probability of its inclusion in the sample.
Random Sampling • Simple Random Sample – A sample designed in such a way as to ensure that (1) every member of the population has an equal chance of being chosen and (2) every combination of N members has an equal chance of being chosen. • This can be done using a computer, calculator, or a table of random numbers
Random Sampling • Systematic random sampling – A method of sampling in which every Kth member (K is a ration obtained by dividing the population size by the desired sample size) in the total population is chosen for inclusion in the sample after the first member of the sample is selected at random from among the first K members of the population.
Stratified Random Sampling • Stratified random sample – A method of sampling obtained by (1) dividing the population into subgroups based on one or more variables central to our analysis and (2) then drawing a simple random sample from each of the subgroups
Stratified Random Sampling • Proportionate stratified sample – The size of the sample selected from each subgroup is proportional to the size of that subgroup in the entire population. • Disproportionate stratified sample – The size of the sample selected from each subgroup is disproportional to the size of that subgroup in the population.
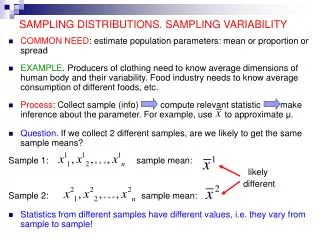
Sampling Distributions • Sampling error – The discrepancy between a sample estimate of a population parameter and the real population parameter. • Sampling distribution – A theoretical distribution of all possible sample values for the statistic in which we are interested.
Sampling Distributions • Sampling distribution of the mean– A theoretical probability distribution of sample means that would be obtained by drawing from the population all possible samples of the same size. If we repeatedly drew samples from a population and calculated the sample means, those sample means would be normally distributed (as the number of samples drawn increases.) The next several slides demonstrate this. • Standard error of the mean– The standard deviation of the sampling distribution of the mean. It describes how much dispersion there is in the sampling distribution of the mean.
Distribution of Sample Means with 21 Samples 10 8 6 4 2 0 S.D. = 2.02 Mean of means = 41.0 Number of Means = 21 Frequency 37 38 39 40 41 42 43 44 45 46 Sample Means
Distribution of Sample Means with 96 Samples 14 12 10 8 6 4 2 0 S.D. = 1.80 Mean of Means = 41.12 Number of Means = 96 Frequency 37 38 39 40 41 42 43 44 45 46 Sample Means
Distribution of Sample Means with 170 Samples 30 20 10 0 S.D. = 1.71 Mean of Means= 41.12 Number of Means= 170 Frequency 37 38 39 40 41 42 43 44 45 46 Sample Means
The Central Limit Theorem • If all possible random samples of size N are drawn from a population with mean y and a standard deviation , then as N becomes larger, the sampling distribution of sample means becomes approximately normal, with mean y and standard deviation .