SAMPLING DISTRIBUTIONS. SAMPLING VARIABILITY
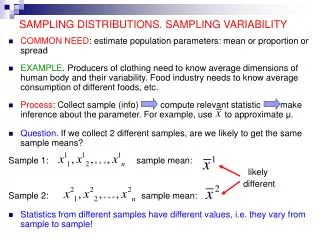
SAMPLING DISTRIBUTIONS. SAMPLING VARIABILITY. COMMON NEED : estimate population parameters: mean or proportion or spread EXAMPLE . Producers of clothing need to know average dimensions of human body and their variability. Food industry needs to know average consumption of different foods, etc.

SAMPLING DISTRIBUTIONS. SAMPLING VARIABILITY
E N D
Presentation Transcript
SAMPLING DISTRIBUTIONS. SAMPLING VARIABILITY • COMMON NEED: estimate population parameters: mean or proportion or spread • EXAMPLE. Producers of clothing need to know average dimensions of human body and their variability. Food industry needs to know average consumption of different foods, etc. • Process: Collect sample (info) compute relevant statistic make inference about the parameter. For example, use to approximate μ. • Question. If we collect 2 different samples, are we likely to get the same sample means? Sample 1: sample mean: likely different Sample 2: sample mean: • Statistics from different samples have different values, i.e. they vary from sample to sample!
SAMPLING DISTRIBUTIONS, CONTD. Values of a statistic computed from different samples will be different. • E.g. values of computed using different samples will be different. • Question: If we repeat sampling many times, what distribution of these sample means would we get? That distribution is called the SAMPLING DISTRIBUTION OF . • E.g. Want to estimate probability of getting H on a coin. Toss the coin 20 times, get . Then, toss it again 20 times, get another value of , etc. • Question: If we repeat sampling many times, what distribution of these sample proportions would we get? That distribution is called the SAMPLING DISTRIBUTION OF .
CHARACTERISTICS OF A SAMPLING DISTRIBUTION Sampling distribution has its own features (parameters) like center and spread. We need to know them for inference. Unbiasedness. Def. A statistic that is used to estimate a parameter is said to be unbiased for that parameter if the sampling distribution of this statistic centers at the true parameter value. i.e. The statistic, on average does not over or under-estimate the parameter. Sampling distribution of a biased statistic Sampling distribution of an unbiased statistic True parameter value
SPREAD OF AN UNBIASED STATISTIC Which of two unbiased statistics is a better estimator of the unknown parameter? The one with larger of smaller spread? The one with smaller spread! Unbiased statistic with larger spread Unbiased statistic with smaller spread True parameter value
“GOOD” STATISTICS A statistic good for estimation is one that • does not systematically over- or under– estimates the parameter, and • is “always” close to the parameter it estimates. DESIARABLE PROPERTIES OF STATISTICS: • UNBIASED FOR THE PARAMETER IT ESTIMATES; • SMALL VARIANCE (error). EXAMPLES: The best statistic for estimation of population mean is sample mean . The best statistic for estimation of the population proportion is the sample proportion .