Understanding Individuals Control Charts for Process Control
Learn how to utilize Individuals Control Charts effectively for monitoring processes. Discover the importance of control limits, addressing potential problems, and interpreting correlations in moving ranges. Avoid inflated control limits by applying proper rules based on median or average moving range values.

Understanding Individuals Control Charts for Process Control
E N D
Presentation Transcript
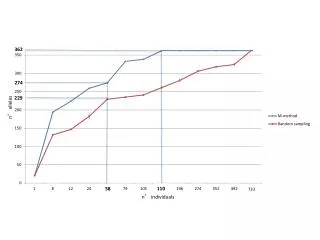
Individuals Chart • Due to High Costs (e.g., destructive testing/measurement) or a lack of data gathering opportunities there may be only one measurement possible in a subgroup. As a rule of thumb, individuals charts should not be used with less than 100 observations. • Control limits:
Potential Problems With Individuals Charts • Correlation in the moving range • Need to be conservative in applying rules 2-5 in the moving range charts. • Since the moving ranges are estimates of process variation, inflated control limits can result if the process variation is not stable throughout the sample. • As a rule of thumb, if 2/3 or more of the moving ranges fall below the centerline, inflated control limits use the median of the moving range values instead of the average in calculating control limits