Data Flow Modelling
Data Flow Modelling. Lecture 4 Introduction to DFDs. What is a Data Flow Model ?. Flow of information. What is a Data Flow Diagram ?. A means of documenting the flow of data through a system. It is a graphical technique which helps:

Data Flow Modelling
E N D
Presentation Transcript
Data Flow Modelling Lecture 4 Introduction to DFDs
What is a Data Flow Model ? Flow of information
What is a Data Flow Diagram ? • A means of documenting the flow of data through a system. • It is a graphical technique which helps: • Provide the analyst in the development with an understanding of the system. • Convey the analyst’s ideas to others.
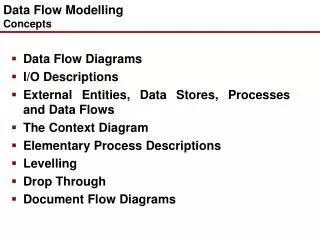
Introduction to DFD’s • A DFD is a diagrammatic representation of the information flows within a system showing: • How the information enters and leaves the system; • What changes the information; • Where information is stored. • Data Flow Diagrams are an important technique for systems analysis inside SSADM.
What does a DFD give us ? • Boundary definition • Checking the completeness of analysis • Basis of system design
information Data information Data What do they represent ? Organisation
Data flows External entities Data flows Data store Data store External entities Components Processes
External Entities An External Entityis whatever or whoever donates information to the system or receives information from it. Represented on a Data Flow Diagram as an Oval containing the name and an identifier. The convention is that the identifier is a lower-case letter. An external entity may be a user of the system, an external organisation, a computer system, or any other source or recipient of information.
Example - External Entity a Customer
A Process A process transforms or manipulates data within the system. Processes are represented by rectangles on a Data Flow Diagram. Each process box contains the name of the process, an identifier, and possibly a location.
Process Boxes • The process name describes the process performed on the data received by the process. • Process identifiers are numerical. • The location of the process is used to denote either - • The place where the process is performed • Or the member of staff responsible for performing the process.
Location Identifier Name Process Box Components 1 Manager Process New Customer
D1 Student Details Data Stores • A datastoreis where information is held within the system. • A data store is represented on a DFD by an open-ended box.
Identifier Description of Data Store D1 Student Details DataStore Components • Every Data Store Identifier is unique – • “M” denotes a Manual data store • “D” denotes an Electronic data store • “T” denotes a Transient data store
Data Flows • A package of information flowing between objects on the Data Flow Diagram. • Represented by a line and an arrow to denote the direction of the information flow. • Labeled with the name or details of the information represented by the data flow.
A CustomerName Customer Customer Name CustomerDetails D1 Example - Data Flows 1 Manager Process New Customer
A Customer D1 Student Details External entity Data store Illegal
D1 D3 Student Details Course Details Data store Data store Illegal
Drawing Data Flow Diagrams • Identify • main inputs & outputs • processes • data flows • Draw Data Flow Diagram • associate data stores • internal data flows
1 Academic A Student Details Student Process New Student Student Details D1 StudentDetails Example
Checking Data Flow Diagrams ? • Every process must have at least one data flow coming from it and one data flow flowing into it. • Every external entity and data-store must have at least one data flow either coming from it, or flowing into it. • For every data flow either its source is a process or its sink is a process.
Correct Processes ? Manager 1 WRONG Register New Customer * Manager 1 CORRECT Register New Customer * Manager 1 WRONG Register New Customer *
d Customer M1 Order File Data Store and External Entity Duplication • It is sometimes necessary to show that certain Data Stores and External Entities are duplicated on the Data Flow Diagram.
Example - Water Heater • A small system is used to process temperatures from a water heater. The temperature is read and passed to the system. If the temperature is outside the stored safety limits then an alarm will sound. • Draw the external entities on the Heater system DFD below.
Example - Supermarket DFD • A supermarket uses point of sale bar code scanners at their checkout tills. The bar code on the product is scanned and is then checked to see if it is valid. If it is a valid bar code then the stock database is updated and an entry for that product is printed on the till receipt. If it is an invalid bar code then an alarm will sound on the checkout till and the operator will need to deal with the problem. • Draw the processes on the Supermarket Data Flow Diagram below.
DFD Summary • Identify the components of a Data Flow diagram • Understand their usage • Make amendments to existing Data Flow diagrams