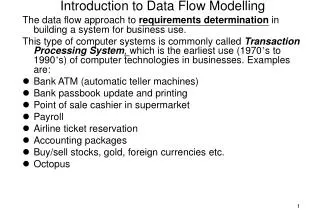
Process Modelling: Introduction to Data Flow Modelling
320 likes | 396 Views
Learn about Data Flow Modelling (DFM) for system analysis, including narrative descriptions, DFD symbols, and components of a data flow model. Understand the importance of describing existing systems and how DFD can reveal weaknesses and identify strengths. Gain insights into creating diagrams that provide a complete model of an information system.

Process Modelling: Introduction to Data Flow Modelling
E N D
Presentation Transcript
Process Modelling:Introduction to Data Flow Modelling Information System AnalysisCOMM1B
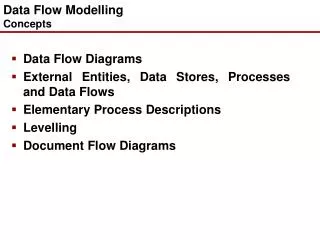
Outline • Is the existing system important? • How do we describe an existing system? • Problems with narrative • Data Flow Diagrams
How important is the existing system? It can been argued: “If we analyse the existing system we will eventually end up with a computerised version of the existing system with all of its problems and weaknesses”
Current system model • Why bother? • Occasionally we do not • Promotes understanding • Provides an accurate and complete view of the existing system • Can reveal weaknesses and identify strengths • Can help identifies information requirements for new system • Examination of the whole picture can enable discussion between developers and users
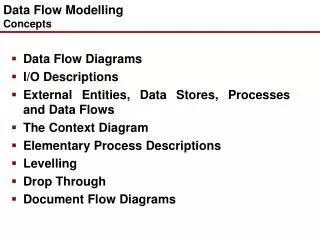
How do we describe an existing system? Narrative description • Can be ambiguous • Can be long-winded • Can be incomplete Data Flow Modelling (DFM) • Diagrammatic • Readable • Even by those without knowledge of the technique
Example: Data Flow Diagram Level 1 Customer 2 Despatch Delivery note Package Order Order goods acknowledgement & despatch * 1 Sales Enter Orders Copy delivery Despatch * note instruction set Weekly credit limit list Internal order form Accounts Goods received note 3 Warehouse Accounts Goods received Control stock note Re-order card Supplier Order Processing System
Data Flow Diagrams • Provide a complete model of the information system showing: • View of system focusing on its data • Where it arrives from • external sources • What the system does to it • processing • Where it is kept • storage • Who receives it • What it is used for
Data Flow Diagrams • A major generic technique • Powerful and useful • Not just in computer based systems development • Notation • There are a number of variations in symbols used (esp. methods used in USA) • Yourdon • Gane and Sarson • We use SSADM notation • All share exactly the same construction
Data Flow Diagram Symbols A data flow A process A data store
Data Flow Diagrams an external entity a physical resource flow (rarely used, never in logical DFDs)
Data Flow Diagram Symbols Labelling: Order Details A data flow Location ID A process Name M1 A data store
Data Flow Diagram Symbols Description (include a ‘doing’ verb) A process b an external entity Name
Example • Following example shows a Data Flow Model of an order processing system • An initial document flow diagram can be used as a starting point • Helps define the boundaries of the system and therefore the agencies which are external
Document Flow Customer Delivery note Despatch Order Order acknowledgement Sales Copy delivery Weekly credit limit list Despatch note instruction set Internal order form Goods received Accounts note Warehouse Accounts Goods received note Re-order card Supplier Order Processing System
Document Flow Customer Delivery note Despatch Order Order acknowledgement Sales Copy delivery Weekly credit limit list Despatch note instruction set Internal order form Goods received Accounts note Warehouse Accounts Goods received note Re-order card Supplier Order Processing System Boundary
Context Diagram (level 0) Accounts Customer Goods received note Copy delivery note Delivery note Re-order card Weekly credit limit list Order Order acknowledgement Order Processing System Goods received note Order Processing System Supplier
Customer 2 Despatch Delivery note Package Order Order goods acknowledgement & despatch * 1 Sales Enter Orders Copy delivery Despatch * note instruction set Weekly credit limit list Internal order form Accounts Goods received note 3 Warehouse Accounts Goods received Control stock note Re-order card Supplier Level 1Data Flow Diagram Order Processing System
Despatch 2 Sales 1 Package goods Order & despatch Entry * * Despatch Internal order instruction set form Accounts 3 Control stock Re-order card 3.1 3.2 Stock Clerk Typist Internal order Type dispatch instruction sheet form Allocate stock to order * * read & update stock M3/1 Stock stock additions 3.3 W'h men Goods Rec 3.4 stock level Check goods Monitor receipt note stock to stock recei- levels * Re-order card Goods received note Goods received note Accounts Accounts Supplier Level 2 DFD:Control Stock
Components of a Data Flow Model • Hierarchic structure • At highest level shows an overview of the system • Level 1 is the most important • Gradually refined into further detail • Level 2, 3 etc • Until system processing is described in the utmost detail: • Elementary process descriptions
Components of a Data Flow Model Level 0 Agency Overall process Agency
Components of a Data Flow Model Level 0 Level 1 Agency 1 Process 2 Overall process Process 3 Agency Process
Components of a Data Flow Model Level 0 Level 1 Level 2 2 Agency 1 2.1 sub Process Process 2 2.2 Overall process sub Process Process 3 2.3 sub Process Agency Process
Components of a Data Flow Model Level 0 Level 1 Level 2 Level 3 2 2.2 Agency 1 2.1 2.2.1 sub Process sub-sub Process Process 2 2.2 2.2.2 Overall process sub Process sub-sub Process Process * 3 2.3 2.2.3 sub Process sub-sub Process Agency Process
Components of a Data Flow Model Level 0 Level 1 Level 2 Level 3 Level 4 2 2.2 2.2.2 Elementary Process Description Decision Tree Decision Table Structured English Agency 1 2.1 2.2.1 sub Process sub-sub Process Process 2 2.2 2.2.2 Overall process sub Process sub-sub Process Process * 3 2.3 2.2.3 sub Process sub-sub Process Agency Process
Basic Rules Data flow lines must NOT cross each other Data MUST pass through a process not between external entities nor between data stores nor external entity to data store (or vice-versa) Process descriptions MUST contain a verb and describe what is happening to DATA They must be concise ie. not a list of sub-processes Data Flow Diagrams
Basic Rules Data stores used by only one process are internal to that process and are not shown in that level diagram A guideline is max. of six processes in one diagram at a particular level You will see examples of eight or more level 1 processes - this is not good practice too much detail difficult to read Key features - clarity, simplicity, completeness Data Flow Diagrams
Basic Rules DFDs are not Systems Flowcharts (an older technique used to describe processing) and do NOT show: the passage of time or sequence of processing operations Although it is common practice to label and draw processes in approximate order for clarity and sense therefore order is sometimes implicit, but not explicit Data Flow Diagrams
Data Flow Diagrams: Summary Powerful modelling tool used at: • Analysis phase • Physical representation of current system • Transformed into Logical view of current system • by removing physical circumstances • Design phase • Logical view of required system • by adding requirements. • Physical representation of required system • CASE tools are often used in their construction
Further Reading • Lejk and Deeks • An Introduction to Systems Analysis Techniques • Chapter 4 Introduction to Data Flow Diagrams • M Goodland and C Slater • SSADM version 4: a Practical Approach • McGraw Hill 1995 • Weaver, Lambrou and Walkley • Practical SSADM version 4+, 2nd Edition • Chapter2 • Pitman Publishing 1998