Download
1 / 25
250 likes | 403 Views
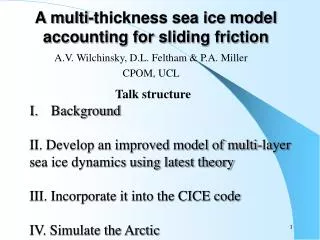
A multi-thickness sea ice model accounting for sliding friction. A.V. Wilchinsky, D.L. Feltham & P.A. Miller CPOM, UCL. Talk structure. Background II. Develop an improved model of multi-layer sea ice dynamics using latest theory III. Incorporate it into the CICE code

E N D
A multi-thickness sea ice model accounting for sliding friction A.V. Wilchinsky, D.L. Feltham & P.A. Miller CPOM, UCL Talk structure • Background • II. Develop an improved model of multi-layer • sea ice dynamics using latest theory • III. Incorporate it into the CICE code • IV. Simulate the Arctic
Ice thickness distribution function g(h) Different floe thickness Fraction of floes of thicknesses, h, is described by g(h) During deformation only ≈15% sea ice ridges
Sea ice stress contributions: • Pressure ridging: • Frictional motion of piling ice blocks 2. Inter-floe frictional sliding
Yield curve Yield curve grows (hardens) or shrinks (weakens) if the ice thickness increases or decreases. > Ice strength In two layer model (thick ice + thin ice) sea ice strength is approximated Thick ice concentration Mean thick ice thickness
II. Develop an improved model of multi-layer sea ice dynamics using latest theory
Sea Ice Strength In modern multi-layer models (Flato & Hibler, 1995): Ridging Strength Potential energy change Ridging mode (loss+gain) In reality (discrete simulation results; Hopkins, 1998): Ridging Strength Friction in ridge piling up Ridge thickness => Ridging rate (loss)
Ridging and Sliding Work In modern multi-layer models (Flato & Hibler, 1995): Their ratio is parameterized. No sliding in pure convergence. In reality (simulation result, Ukita & Moritz, 2000): It depends on deformation pattern: Ridging work contribution Sliding work contribution Divergence=Shear Pure divergence Pure convergence Convergence=Shear Shear
Incorporating more “reality” into sea ice models - Use the law for the ridging ice strength • Use the ridging and sliding strain-rate modes • found by Ukita and Moritz for uniform thickness • Account for the thickness difference by making use • of sliding and opening participation functions that • say that more sliding and opening occur in thinner • ice.
Derived sea ice stress Ridging strength Sliding strength Opening strength
Composite yield curve shape For submarine-measured ice thickness distribution: k = importance of sliding to ridging Normalised yield curves for regions A and B (Wadhams, 1992) Smoothed ice thickness distribution for regions A and B (Wadhams, 1992)
Incorporation into the Elastic Viscous Plastic model EVP model is tied to Hibler’s rheology through D and e Ellipse aspect ratio Relaxation time General plastic rheology form, including our new model: Modified EVP model for general rheology:
Modification in the CICE code components NEW AFFECTED New Ridging Rate (determined by ridging mode) Ice thickness Evolution Ice Thermodynamics New Ice Strengths for ridging, sliding and opening Ice Dynamics New Rheology
Used ridging strengths Present: Area loss Rothrock: Area gain - loss Hibler: Ice concentration 2.718281828459045235 Mean thickness
Tuning Comparison of the mean ice thickness in the Arctic given by the PRESENT and CICE model with the ERS derived. ERA-40 wind forcing data.
Comparisons with submarine ice drafts. The observed ice draft (m) along eight submarine cruise tracks from 1987 to 1997.
Mean ice thickness along submarine cruises. 1. Comparison with data.
Mean ice thickness along submarine cruises. 2. Comparison with Paul’s model
Mean ice thickness along submarine cruises. 3. Shear stress effect. Maximum shear stress
Results I. A new isotropic model has been developed and incorporated into CICE that includes 1. More realistic plastic strength of multi-layer sea ice. 2. More realistic ridging rate. II. Ice thickness distribution is better than CICE-produced, worse than given by Paul’s model. III. Improvement due to a better ridging rate expression. Further work • Issues with multi-layer ice strengths (e.g. Rothrock’s)
Sliding strength Ps*=k Pr* Energy partitions given by Ukita and Moritz’s kinematic model and Hopkins’ dynamic one.
Areal fraction of mean ice thickness. Present rheology. ERS covered area.
Areal fraction of mean ice thickness. Hibler’s rheology. ERS covered area.
Mean ice thickness along submarine crusies. 1. Ridging strength effect.