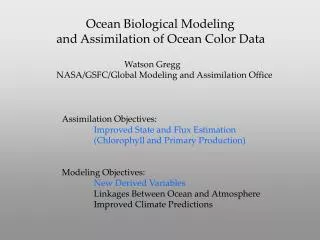
Ocean Modeling and Data Analysis
Ocean Modeling and Data Analysis. Working Group Discussion 10:50-12:20 July 21, 2010 Seattle, Washington, USA. Charge. Coordinate efforts and develop methods to exploit Aquarius SSS to study ocean variability and air-sea interactions using data analysis and ocean models.

Ocean Modeling and Data Analysis
E N D
Presentation Transcript
Ocean Modeling and Data Analysis Working Group Discussion 10:50-12:20 July 21, 2010 Seattle, Washington, USA
Charge • Coordinate efforts and develop methods to exploit Aquarius SSS to study ocean variability and air-sea interactions using data analysis and ocean models
Working Group Tasks and Topics--- 3 Phases --- • Phase 1: Pre-launch • Launch • Phase 2: In Orbit Checkout (IOC), Launch + 45 days • Post Launch Assessment Review (PLAR) • Phase 3: IOC + 6 months • Science team meeting
“Ocean Modeling and Data Analysis” Working Group Chair: Yi Chao [Yi.Chao@jpl.nasa.gov] Arnold Gordon [agordon@ldeo.columbia.edu]Frank Bryan [bryan@ucar.edu]Bill Large [wily@ncar.ucar.edu] Fred Bingham [bigkahuna@fredbingham.com]Alberto Piola [apiola@hidro.gov.ar]Raul Guerrero [raul.guerrero@inidep.edu.ar]Rui Ponte [rponte@aer.com]Ichiro Fukumori [ichiro.fukumori@jpl.nasa.gov]Nikolai Maximenko [maximenk@hawaii.edu]Tony Busalacchi [tonyb@essic.umd.edu] Gary Lagerloef [lager@esr.org] Steve Riser [riser@ocean.washington.edu] Tangdong Qu [tangdong@hawaii.edu]Rong Zhang [rzhang@essic.umd.edu]Hsun-Ying Kao [hkao@esr.org]Gene Feldman [gene.c.feldman@nasa.gov]Frank Wentz [frank.wentz@remss.com]Claudia Giulivi [claudiag@ldeo.columbia.edu]Eric Hackert [ehackert@essic.umd.edu]Samuelraj Daniel Jacob [samuelraj.d.jacob@nasa.gov]Nadya Vinogradova [nvinogra@aer.com]James Potemra [jimp@hawaii.edu]Oleg Melnichenko [oleg@hawaii.edu]
How would you like to communicate beyond emails? • Aquarius/SAC-D Information and Discussion Forum • http://aquarius.gsfc.nasa.gov/forum/aquarius/forum_show.pl • Limitations: • No documents (.doc, .ppt) • No images (.gif) • No group mailing/broadcasting • Other tools: Google Doc, Google Group • Other ideas…please email Yi.Chao@jpl.nasa.gov
Phase 1: Pre-launch, Now to April 2011 • Assigned Task: To identify, assess and recommend a near real-time data set for SSS (SST, surface vector wind, waves) to be used by the Aquarius simulator • The data need to have the following characteristics • Global • Accessible in a public domain • Available in near real-time (similar to IGDR SSH data with a latency no more than a week) • Reasonable performance comparing with the observational data available • Web space: http://ourocean.jpl.nasa.gov/SSS/ (sandbox to assess data quality before recommending to Aquarius at GSFC/ESR)
SST Task working with GHRSST • Is the current NCEP Reynolds SST the best for Aquarius? • If not, which GHRSST L4 products can be considered as the alternative/backup data set? • Who: If you would like to help, please email Yi.Chao@jpl.nasa.gov
Proposed SSS: 1/12 deg HYCOM • HYbrid Coordinate Ocean Model (HYCOM) • Vertical coordinate • Isopycnal in the open stratified ocean • Terrain-following in shallow coastal regions, and • Z-level (depth) near the surface mixed layer • 1/12° Global & 32 layers • Navy Operational Global Atmospheric Prediction System (NOGAPS) • Navy Coupled Ocean Data Assimilation (NCODA)
Subsurface Salinity from 1/12 deg HYCOM 0, 250, 500, 1000 meters
SSS Simulated by Models • HYCOM • Other U.S. Navy models: NCOM, NLOM • Mercator Ocean • ECCO (JPL, Hamburg) • Reanalysis: SODA, POP • IPCC climate models
20th Century CMIP3 Simulated Mean Ocean Surface Salinity CCMAT47 CCMAT63 CNRM CSIRO GDFL20 MEAN IAP BCCR IPSL MIROCHR MIROCMR MRI NCAR UKMOCM3 GISSEH GISSER (10^-3) Waliser, Chao, Li, et al., 2010, In Prep
20th Century CMIP3 Simulated Standard Deviation of Monthly Ocean Surface Salinity Anomalies are about the Annual Cycle CCMAT47 CCMAT63 CNRM CSIRO GDFL20 STD IAP BCCR IPSL MIROCHR MIROCMR MRI NCAR UKMOCM3 GISSEH GISSER (10^-3) Waliser, Chao, Li, et al., 2010, In Prep
Argo 2005 Salinity Mean Argo 2005 Salinity STD WOA2005 Salinity Mean WOA2005 Salinity STD
Phase 1: Pre-launch, Now to April 2011 • Assigned Task: To identify, assess and recommend a near real-time data set for SSS (SST, surface vector wind, waves) to be used by the Aquarius simulator • The SSS data need to have the following characteristics • Global • Accessible in a public domain • Available in near real-time (similar to IGDR SSH data with a latency no more than a week) • Reasonable performance comparing with the observational data available
NCEP is used today; What about NOGAPS? Who: If you would like to help, please email Yi.Chao@jpl.nasa.gov What: in situ data; comparisons; statistics; what else?
WW3: SWH, MSS(x, y) Who: If you would like to help, please email Yi.Chao@jpl.nasa.gov What: in situ data; comparisons; statistics; what else?
In Orbit Checkout (IOC): Launch + 45 daysPost Launch Assessment Review (PLAR) • First…Aquarius… • First Aquarius SSS weekly map (L3a) • First SSS 7-10 days map merging Aquarius with Argo+drifter+ships+moorings (L3b) • First SSS 7-10 days map merging Aquarius with Argo+drifter+ships+moorings and SMOS (L3c) • First assimilated SSS maps from ??? models (L4) • Data analysis and model results from YOU
Fred Bingham UNCW
Important pre- and post- launch activities: - Pre-launch, determine spatial statistics from the model and from in situ data, decorrelation scales, variances, coefficients of variation, anisotropy, etc. - Post-launch, compare model and in situ statistics with those from Aquarius to the extent possible given the differing sampling scales.
Steve Riser UW
T S 6/24/2009 - 7/15/2009 Upper 5 m; t 2 hr; 0-150 m T and Snear the surface relative to values at 15 dbar Example of UW float equipped with STS sampling
Wind Speed Rainfall Rainfall (mm/hr) and Wind Speed (m/sec) Wind speed and rainfall from UW float 6916 near HOT (STS-equipped)
Deployments of STS-equipped Profiling Floats Through 7/19/2010
Spatio-Temporal Variability and Error Structure of Sea Surface Salinity in the Tropics A.Busalacchi – ESSIC Co-Is: G. Alory CNAP/Legos (Toulouse, France), P.A. Arkin – CICS/ESSIC, J. Ballabrera-Poy – ICM/CSIC (Barcelona, Spain), T. Delcroix – IRD/LEGOS (Toulouse, France), E. Hackert - ESSIC, J. Janowiak – CICS/ESSIC, R. Murtugudde - ESSIC, M. Sapiano – CSU/Dept. Atmos. Sc., R.H. Zhang - ESSIC
Project Goals • Determine SSS error fields over tropical oceans • Identify SSS standard deviation, decorrelation scales, representativity error (RE) and signal to noise ratios (SNR) • In addition to these project goals of calculating SSS error fields we plan to address the following scientific questions • Can Aquarius SSS lead to better estimates of vertical salinity profiles? • Can SSS be validated using satellite estimates of precipitation, evaporation, and other ancillary data?
Phase 3: IOC + 6 monthsScience Team Meeting after launch • More Data analysis and model results from YOU • Special journal issues