RB Expression and Phosphorylation in GBM and GSCs
50 likes | 128 Views
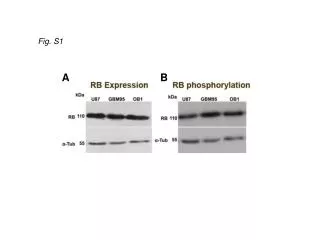
This study presents Western blotting analysis of RB expression and phosphorylation levels in GBM cell lines U87 and GBM95, as well as GSCs OB1. Characterization of OB1 GSC line and caspase-3 immunostaining in U87 cells post-treatment are also depicted.

RB Expression and Phosphorylation in GBM and GSCs
E N D
Presentation Transcript
Fig. S1 A B
Supplementary Figure Legends: Figure S1. RB expression and RB phosphorylation levels in GBM cells and GSCs Representative Western Blotting images of three independent experiments, showing the levels of RB expression (A) and RB phosphorylation at ser 807/811 residues (B) in GBM cell lines U87 and GBM95 and GSCs OB1. α-Tubulin was used as loading control. Figure S2. OB1 GSC line characterization A) Photomicrographies showing representative images of immunocytochemistry staining of oncospheres of OB1 cells with nestin, CD-133 and sox-2 antibodies (red). Nuclei were stained with 4',6-diamidino-2-phenylindole dihydrochloride (DAPI, blue) .B) Photomicrographies showing representative phase contrast images of OB1 cultures at different time points. OB1 cells were plated into 96-well plates at 1cell/well density at day one (D1). After 90 days in culture (D90), oncospheres were dissociated, as second passages, into 96-well at the same density, demonstrating OB1 self-renewal capacity. Scale bar = 10μm. Figure S3. Cleaved caspase-3 immunostaining images Representative images of three independent experiments of Cleaved caspase-3 immunostainning (green) in U87 cells after 24 hours of 1μM VP-16 treatment; experimental groups as indicated. Nuclei were stained with 4',6-diamidino-2-phenylindole dihydrochloride (DAPI). Scale bar = 100μm. Figure S4. Western blot for phospho-p53 (ser 15) Representative phospho-p53 (ser 15) immunoblot for A172, U373 and T98G cells 24 hours post-VP-16 treatment; experimental groups as indicated. α-Tubulin was used as loading control.


![[Fig. S1]](https://cdn3.slideserve.com/6448662/slide1-dt.jpg)


