Download
1 / 14

E N D
Disclaimer This presentation is given by a representative of Colonial First State Investments Limited AFS License 232468 (Colonial First State). The presenter does not receive specific payments or commissions for any advice given in this presentation. The presenter, other employees and directors of Colonial First State receive salaries, bonuses and other benefits from it. Colonial First State receives fees for investments in its products. For further detail please read our Financial Services Guide (FSG) available at colonialfirststate.com.au or by contacting our Investor Service Centre on 13 13 36. All products are issued by Colonial First State Investments Limited ABN 98 002 348 352. Prospectuses or Product Disclosure Statements (PDSs) describing the products are available from Colonial First State. The relevant prospectus or PDS should be considered before making a decision about any product. This presentation does not take into account your individual objectives, financial situation or needs. You should assess whether the information is appropriate for you and consider talking to a financial adviser before making an investment decision. The information is taken from sources which are believed to be accurate but Colonial First State accepts no liability of any kind to any person who relies on the information contained in the presentation.
Investing in the previous year’s best performing asset class Asset Class Value Cumulative returns for each year to 31 December 2002. Data based on index returns, all distributions reinvested. Source: UBS Warburg Australia Bank Bill Index (91 day Commonwealth Treasury Note Index pre Jan 1989), UBS Warburg Australian Composite Bond Index 0+ Years (CBBI All Series All Mats Accumulation pre Oct 1989), S&P/ASX 200 Property Accumulation Index (ASX Property Trusts Accumulation Index pre April 2000), S&P/ASX 300 Accumulation Index, (ASX All Ordinaries Accumulation Index pre April 2000), MSCI World Net Index ($A). IRESS, RIMES
Investing in the previous year’s worst performing asset class Asset Class Value Cumulative returns for each year to 31 December 2002. Data based on index returns, all distributions reinvested. Source: UBS Warburg Australia Bank Bill Index (91 day Commonwealth Treasury Note Index pre Jan 1989), UBS Warburg Australian Composite Bond Index 0+ Years (CBBI All Series All Mats Accumulation pre Oct 1989), S&P/ASX 200 Property Accumulation Index (ASX Property Trusts Accumulation Index pre April 2000), S&P/ASX 300 Accumulation Index, (ASX All Ordinaries Accumulation Index pre April 2000), MSCI World Net Index ($A). IRESS, RIMES
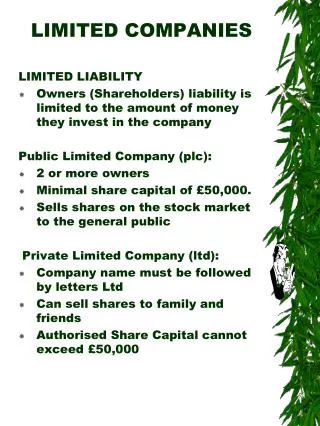
What are the two main investment risks ? • Loss of capital • Not meeting your investment objectives
Shares can provide capital growth & incomeReturn on investment of $100,000 in Shares vs Term Deposits Income Capital Value Source: IRESS, S&P ASX All Industrials used prior to July 2002. S&P ASX 300 Industrials used after July 2002. Reserve Bank of Australia, ‘Bank Deposits $5,000-$100,000 1 year rates’
What has inflation done to $100,000? $100,000 $ $38,925 Source: IRESS. Data to 31st December 2003
Shares or cash? Rolling one year returns Return *35% Australian shares; 25% Global Shares; 10% Aust Property Securities; 25% Aust Fixed Interest; 5% Cash Source: UBS Warburg Australia Bank Bill Index (91 day Commonwealth Treasury Note Index pre Jan 1989), UBS Warburg Australian Composite Bond Index 0+ Years (CBBI All Series All Mats Accumulation pre Oct 1989), S&P/ASX 200 Property Accumulation Index (ASX Property Trusts Accumulation Index pre April 2000), S&P/ASX 300 Accumulation Index, (ASX All Ordinaries Accumulation Index pre April 2000), MSCI World Net Index ($A). IRESS/RIMES
Shares or cash? Rolling five year returns Return *35% Australian shares; 25% Global Shares; 10% Aust Property Securities; 25% Aust Fixed Interest; 5% Cash Source: UBS Warburg Australia Bank Bill Index (91 day Commonwealth Treasury Note Index pre Jan 1989), UBS Warburg Australian Composite Bond Index 0+ Years (CBBI All Series All Mats Accumulation pre Oct 1989), S&P/ASX 200 Property Accumulation Index (ASX Property Trusts Accumulation Index pre April 2000), S&P/ASX 300 Accumulation Index, (ASX All Ordinaries Accumulation Index pre April 2000), MSCI World Net Index ($A). IRESS/RIMES
Shares or cash? Rolling ten year returns Return *35% Australian shares; 25% Global Shares; 10% Aust Property Securities; 25% Aust Fixed Interest; 5% Cash Source: UBS Warburg Australia Bank Bill Index (91 day Commonwealth Treasury Note Index pre Jan 1989), UBS Warburg Australian Composite Bond Index 0+ Years (CBBI All Series All Mats Accumulation pre Oct 1989), S&P/ASX 200 Property Accumulation Index (ASX Property Trusts Accumulation Index pre April 2000), S&P/ASX 300 Accumulation Index, (ASX All Ordinaries Accumulation Index pre April 2000), MSCI World Net Index ($A). IRESS/RIMES
Shares or cash? Rolling twenty year returns Return *35% Australian shares; 25% Global Shares; 10% Aust Property Securities; 25% Aust Fixed Interest; 5% Cash Source: UBS Warburg Australia Bank Bill Index (91 day Commonwealth Treasury Note Index pre Jan 1989), UBS Warburg Australian Composite Bond Index 0+ Years (CBBI All Series All Mats Accumulation pre Oct 1989), S&P/ASX 200 Property Accumulation Index (ASX Property Trusts Accumulation Index pre April 2000), S&P/ASX 300 Accumulation Index, (ASX All Ordinaries Accumulation Index pre April 2000), MSCI World Net Index ($A). IRESS/RIMES
8 7 6 5 4 Dec-92 Dec-94 Dec-96 Dec-98 Dec-00 Dec-02 Dec-04 Interest rates Source: Bloomberg, RBA Cash rate June 2004
The imputation impact Marginal tax rate: 31.50% Marginal tax rate: Cash Shares Cash Shares Investment 100,000 100,000 Investment 100,000 100,000 Dividend Yield - 4%, Fully Franked - 4,000 Dividend Yield - 4%, Fully Franked - 4,000 Interest - 4.75% 4,750 - Interest - 4.75% 4,750 - Imputation credit - 1,714 Imputation credit - 1,714 Gross/taxable return 4,750 5,714 Gross/taxable return 4,750 5,714 Tax incurred @ 31.5% 1,496 1,800 Tax incurred @ 48.5% 2,304 2,771 Less Imputation credit - 1,714 Less Imputation credit - 1,714 Tax payable 1,496 86 Tax payable 2,304 1,057 After tax return 3,254 3,914 After tax return 2,446 2,943 After tax yield 3.25% 3.91% After tax yield 2.45% 2.94% * Assumes a corporate tax rate of 30%, cash return of 4.75%, dividend yield of 4%
Conclusion • Investment markets are unpredictable • Cash is often not the best long term investment strategy • The impact of tax & inflation is important in investing • Investing for the long term smooths returns