Download
1 / 13
130 likes | 265 Views
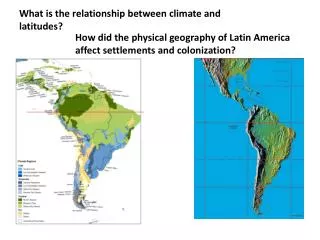
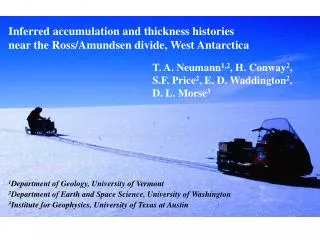
Climate history near the divide between the Ross and Amundsen Seas by H. Conway, Ed Waddington, Tom Neumann, Ginny Catania, Erin Pettit, Felix Ng and Dave Morse. Ridge BC. Ice Stream C. Acknowledgements: National Science Foundation

E N D
Climate history near the divide between the Ross and Amundsen Seas by H. Conway, Ed Waddington, Tom Neumann, Ginny Catania, Erin Pettit, Felix Ng and Dave Morse Ridge BC Ice Stream C • Acknowledgements: • National Science Foundation • Raytheon Polar Services (especially Curt LaBombard, Joni English and Jeanine Watkins), Air National Guard and Ken Borek Air for logistical support • M. Conway for assistance in the field Ridge AB Photo by Erin Ice Stream A
1. Probing for a new site for deep drilling 2. Constraining past climate, thickness and configuration of WAIS Evidence for big ice sheet comes from: - elevated moraines beside outlet glaciers, some of which have been dated (e.g. Denton et al, 1989; Ackert et al, 1999; Stone et al, 2003) - sediment cores from the Ross Sea that indicate grounded ice about 1000km beyond its present position (e.g. Domack et al, 1999; Shipp et al, 1999; Licht et al, 1999; Anderson et al, 2002) thick-ice LGM reconstruction (from Denton and Hughes, 2001)
thin-ice LGM reconstruction (from Denton and Hughes, 2001) • Evidence for little ice (at least in the central Ross Sea Embayment) comes from: • - comparison of stable isotopes at Siple Dome and Taylor Dome suggests only modest thinning (O(100m)) of Siple Dome during the Holocene (Steig, 2003) • thermo-mechanical modeling of the ice streams suggests thickness changes of O(100m) at the present-day grounding line (Parizek et al., 2003, 2002)
Climate and thickness history from depth-age data (Waddington et al., 1999; 2001; 2003) Siple Dome 994 m • Depth and thickness of layer of age A • depends on: • past climate(accumulation history) • past ice dynamics (strain-thinning of a layer) 0 m present 100k BP • a thin layer might be produced by a lot of strain-thinning and/or low accumulation in the past and vice versa • we use the depth-age data to constrain a model of depth-age relationship • - a trade-off between accumulation and dynamics
Matching model with data from Siple Dome 994 m Layer-thickness profile Depth-age profile 0 m present Accumulation history 115k BP present 115k BP
Model results from Siple Dome inferred accumulation history - change from present (0.12 m/yr) 1750 m thick-ice prescribed 994 m 0.8x present 0 m inferred accumulation history - change from present (0.12 m/yr) thin-ice prescribed 0.45x present present 120k BP present 120k BP
Appeal to data from Byrd • BS68 retrieved in 1968 (Gow et al., 1968) • - accumulation = 0.11 m/yr of ice(Gow et al., 1972; Langway et al, 1994) • depth-age(Hammer et al., 1994; Blunier and Brook, 2001) • thickness = 2164m; thinned 200m during Holocene(Steig et al., 2001) • - chemistry and volcanics(Gow and Williamson, 1971; Kyle et al., 1981; Palais, 1985; Palais et al., 1988; Wilch et al., 1999) prescribe 200m thinning during Holocene inferred accumulation history - change from present (0.11 m/yr) 2148m 0.7x present 0m present present 120k BP 120k BP
Depth-age relationship (Hammer et al, 1994; Blunier and Brook, 2002) Old faithful @ 1280m Bed @ 2180m • Ground-based 1.5 MHz radar (2003): • low-frequency radar-detected layers are probably isochrones (acidity contrast inhereted from snow deposition) • bright layer (“old faithful”) at 1280m - corresponds to “off-scale acidity … due to excessive volcanism” (Hammer et al. 1994); age is 17.5-18k BP
Old faithful Bed Byrd core
Measurements (guided by SOAR data from Morse/Blankenship): - radar at 1MHz, 1.5MHz, 7 MHZ, and 200MHz along flow lines - GPS surveys of poles (strain grid comprised of 100 poles)
Results from Inland Site E: Measurements so far …. + + + • - accumulation = 0.22 m/a ice - from tracking continuous near surface radar layers (200 MHz) back to an ITASE core where accumulation is 0.24 m/a (pers comm, Dan Dixon) • depth-age relationship from tracking radar layers (1.5MHz) back to Byrd + + Old faithful + bed @ 3460 m (from low frequency radar)
3460m Model results from Inland site E Model results Old faithful 0m Photo by Erin inferred accumulation history (change from the modern 0.22 m/yr) • site E is 30 km from present divide. Prescribe no thickness change in past 20 k yrs • limited because the radar-derived time scale extends back only 17.5 kyrs 0.6x present present 25k BP
Summary • Inversion of depth-age data to estimate ice sheet thinning is complicated by the trade-off between accumulation and dynamics • data from Byrd and preliminary data from Inland WAIS indicate that caution is needed when adapting an accumulation history inferred from Vostok; results suggest that accumulation during the glacial in WAIS may have been • as much as 60-70% that of today • Need to look at all available data; • the new Inland Wais core will add • more pieces to the puzzle Vostok: accumulation history derived from temperatures inferred from stable isotopes 0.45x present present 120k BP